ASX Trader (Dave) - Trade analysis
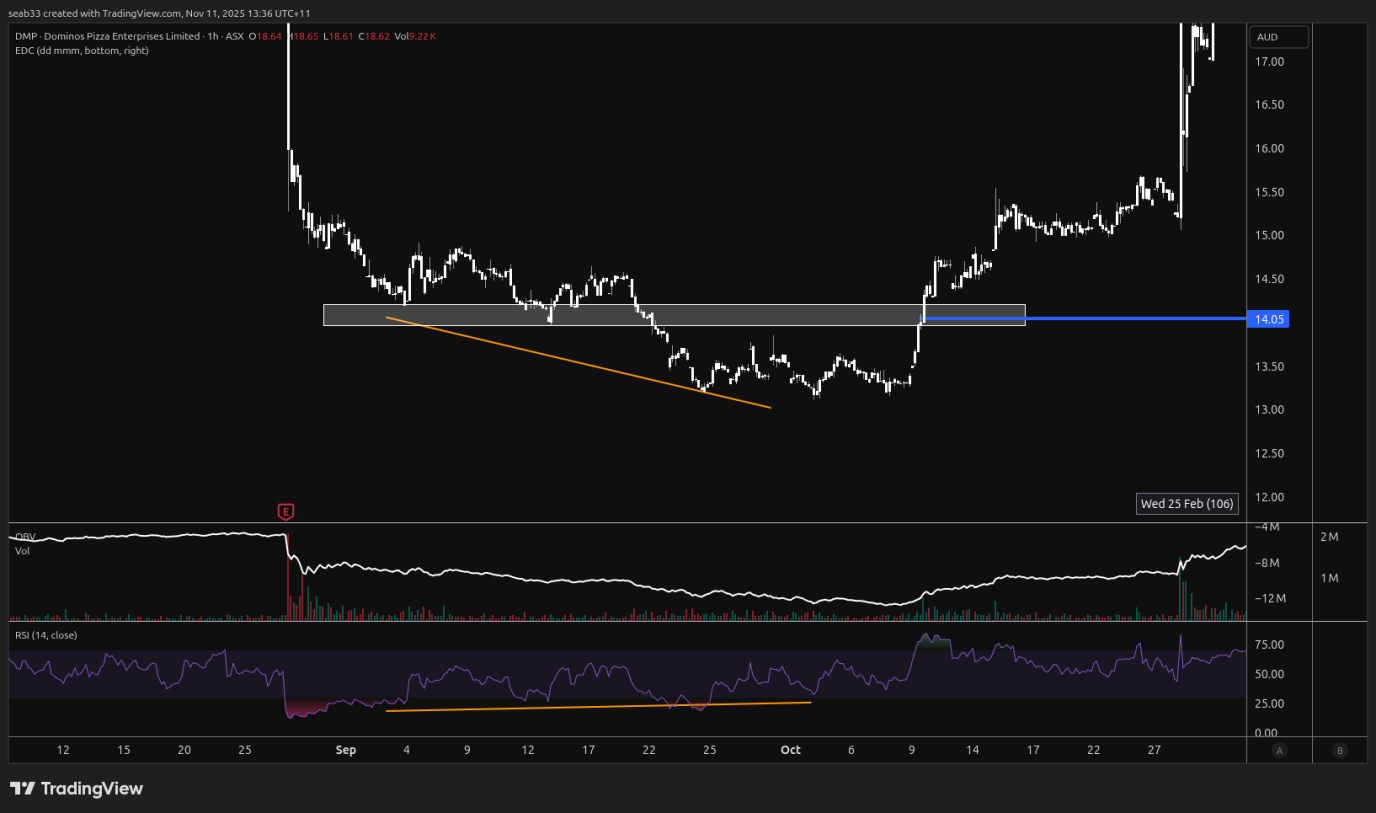
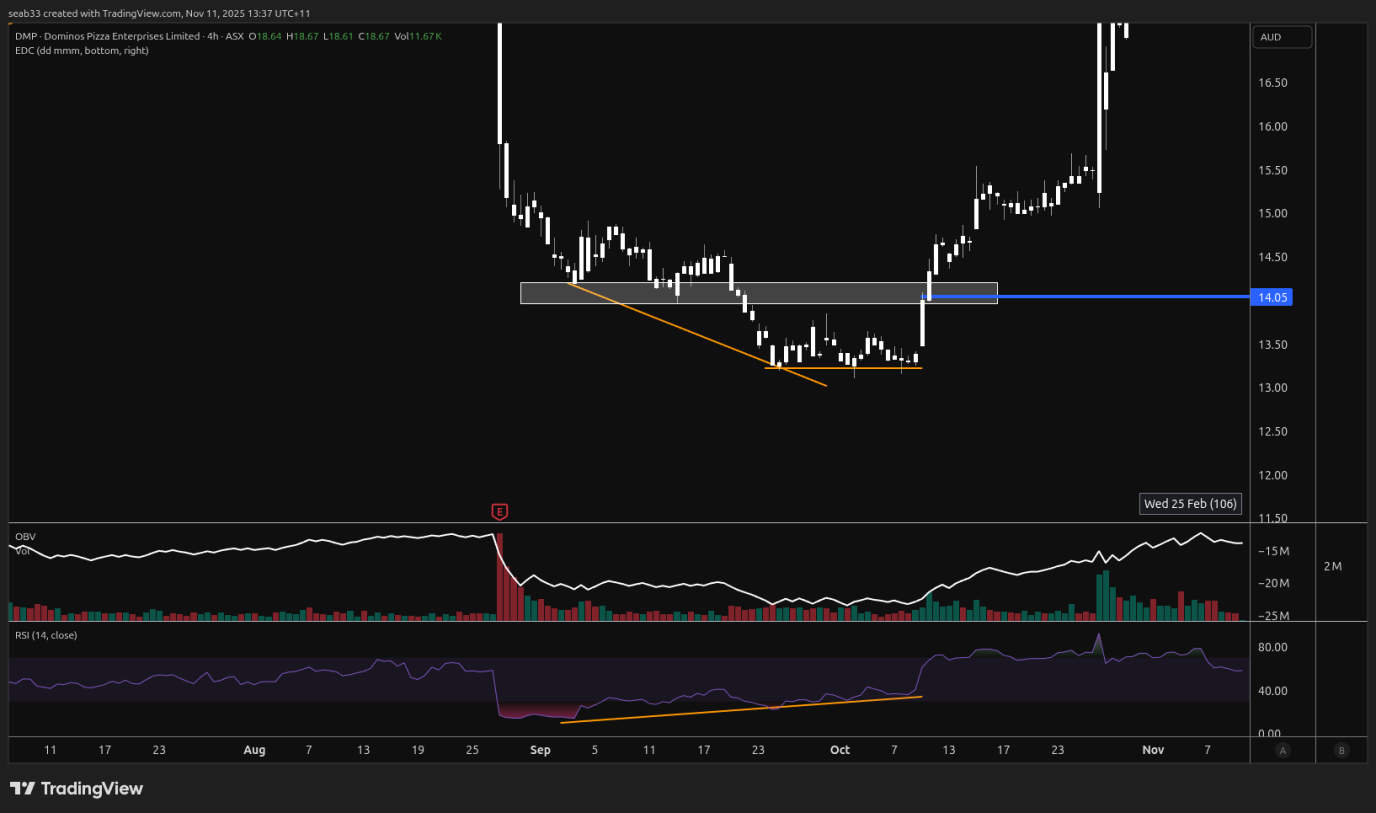
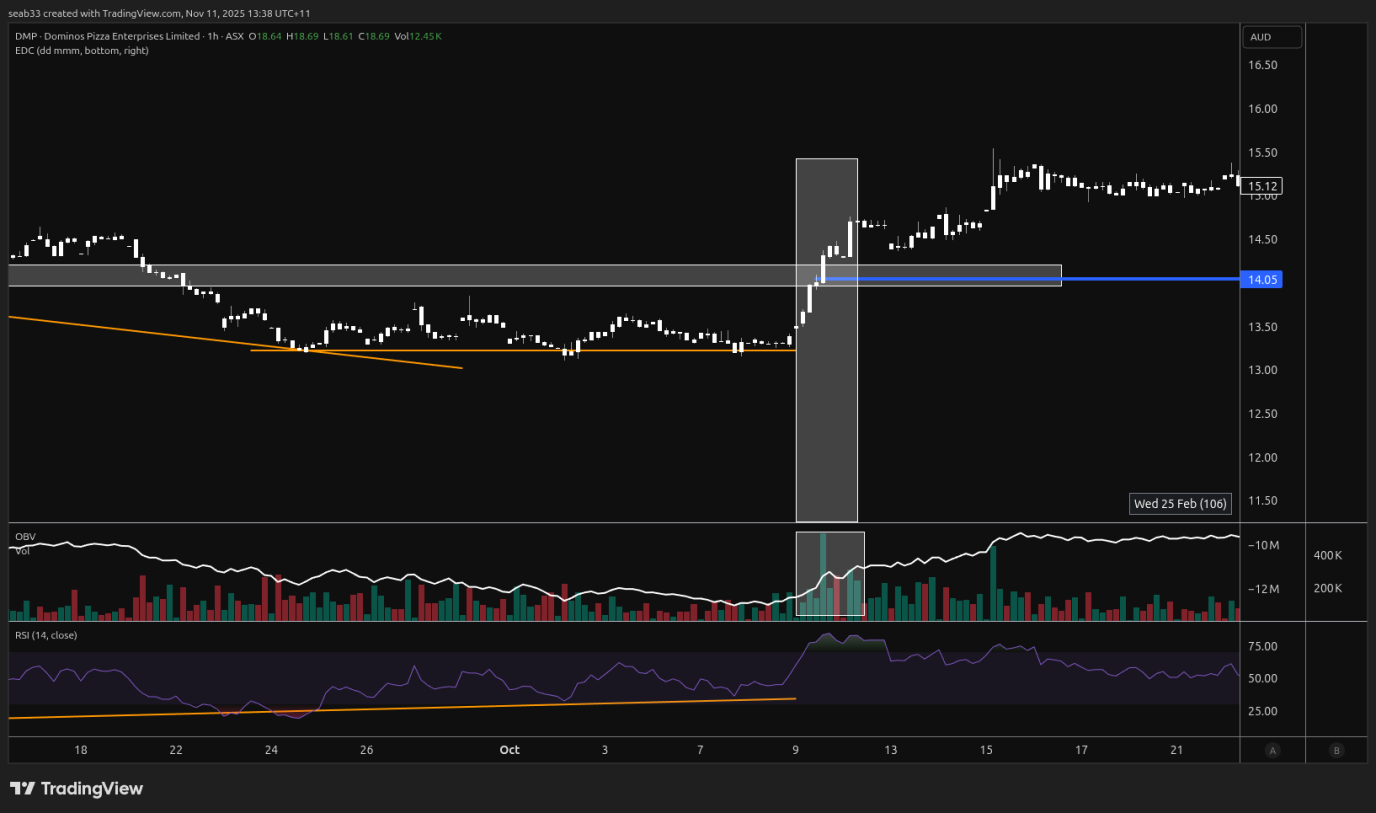
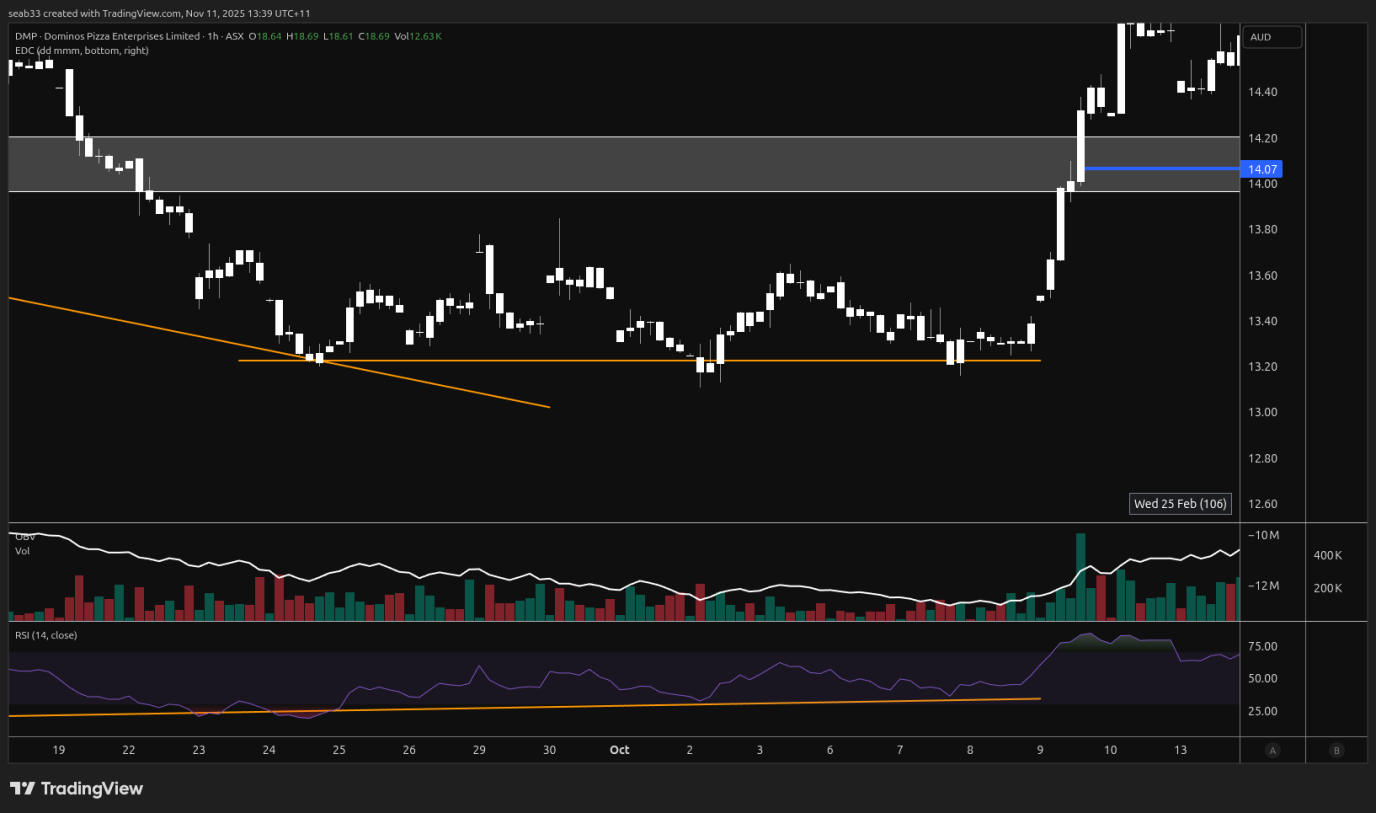
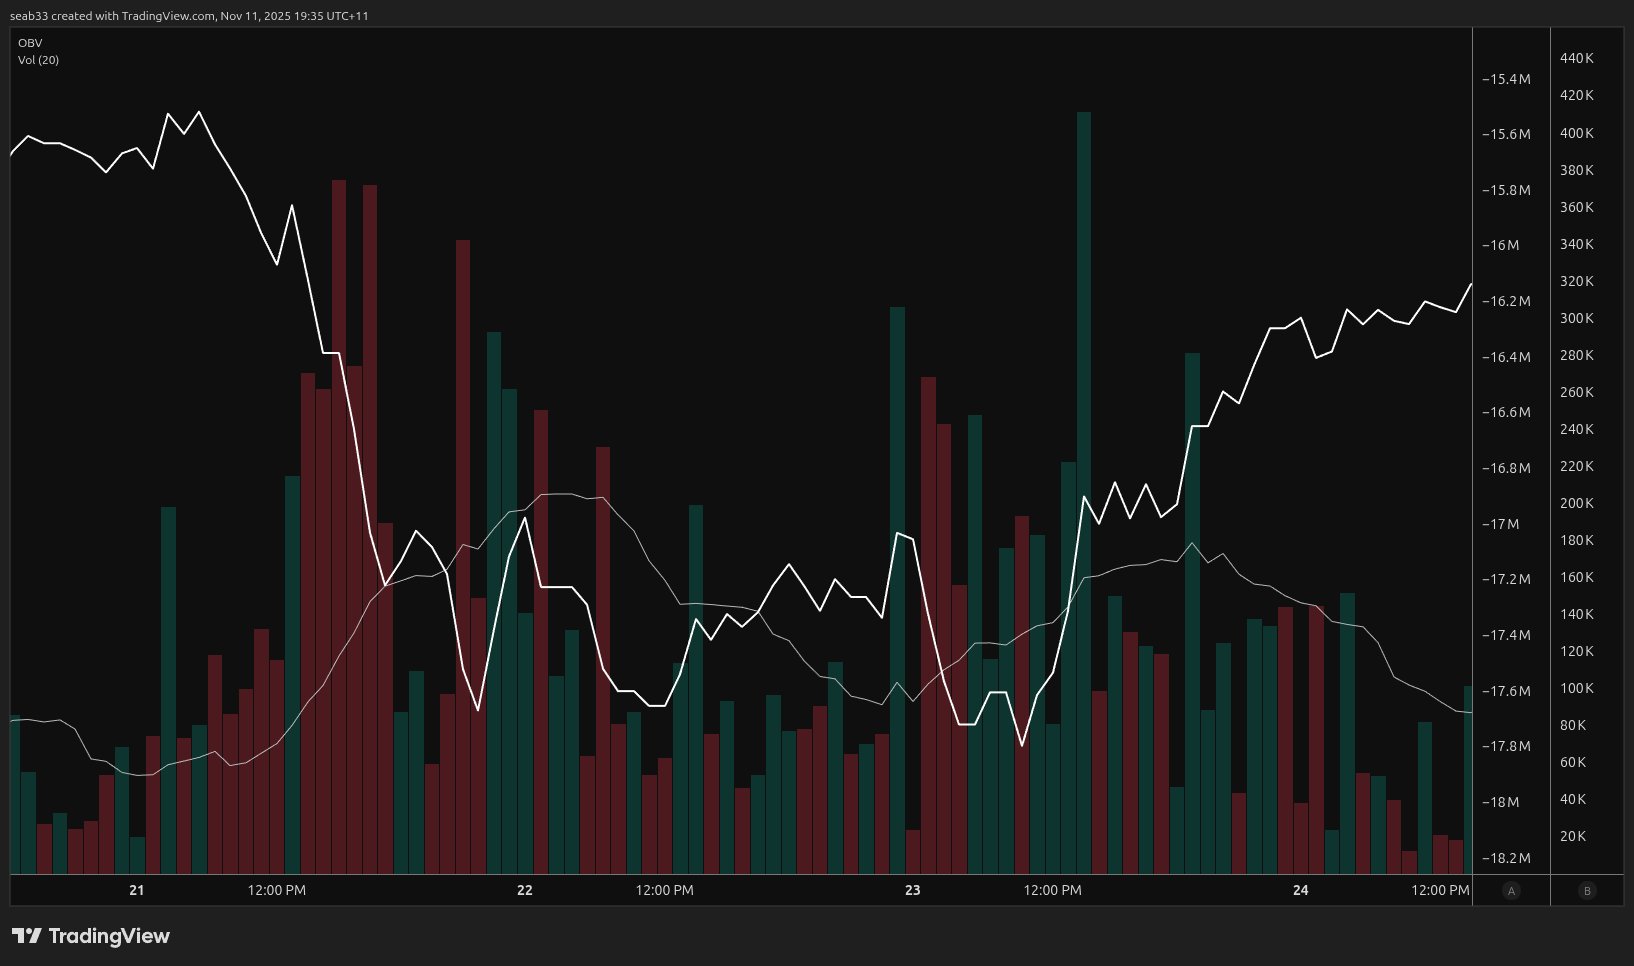
DMP
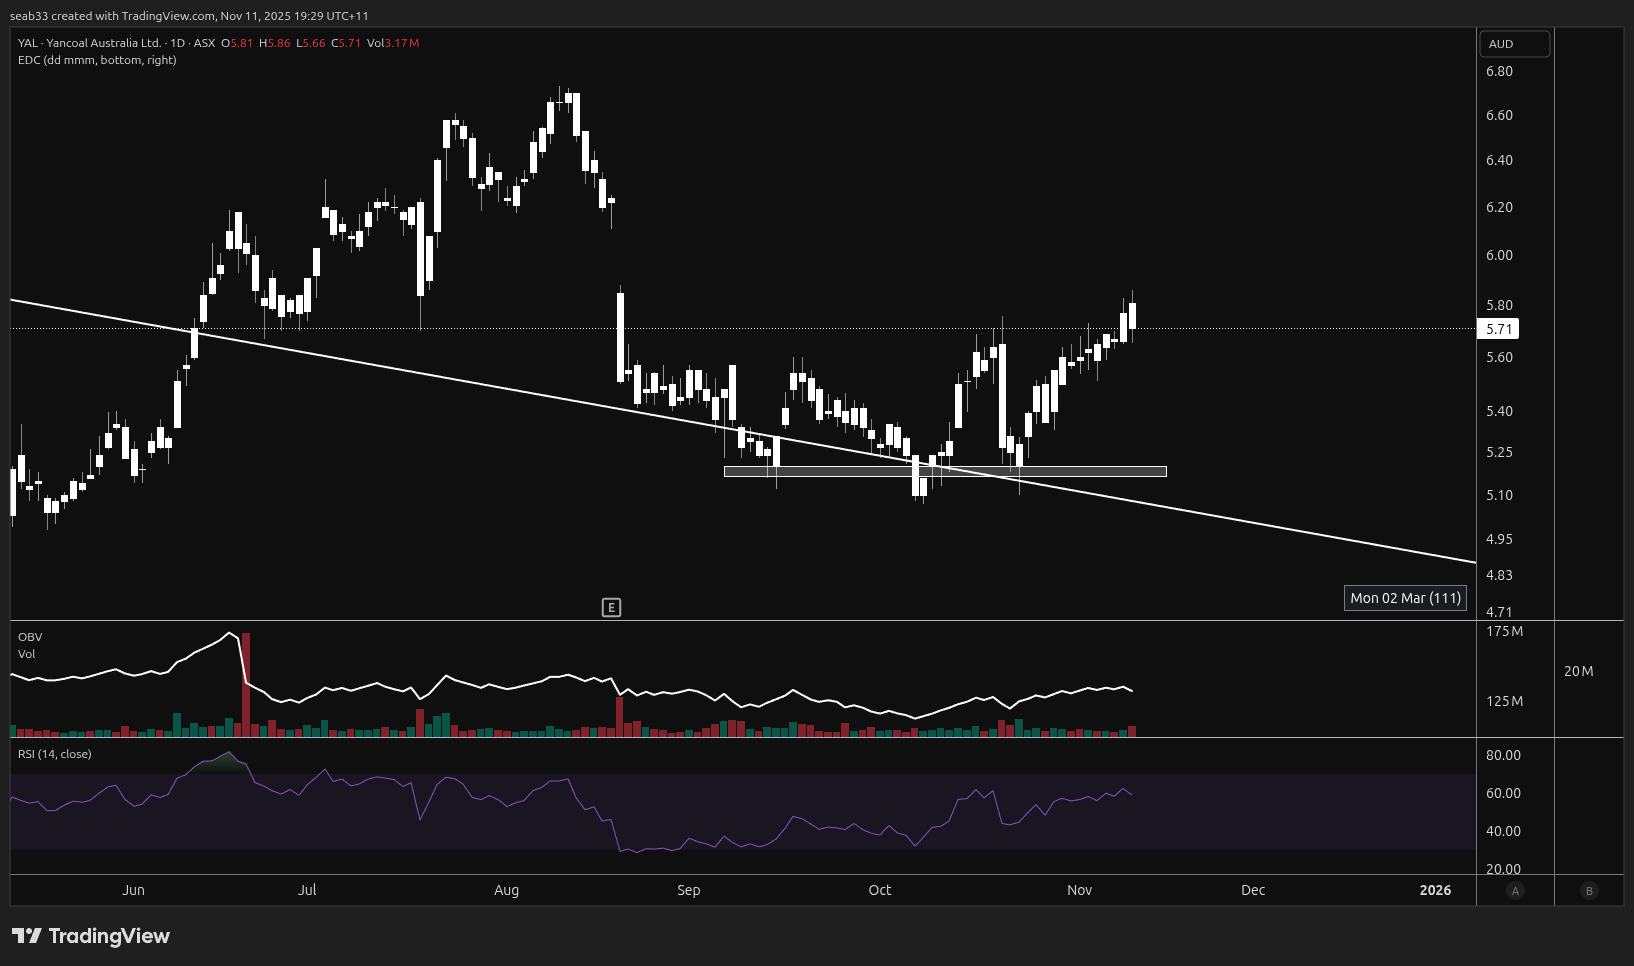
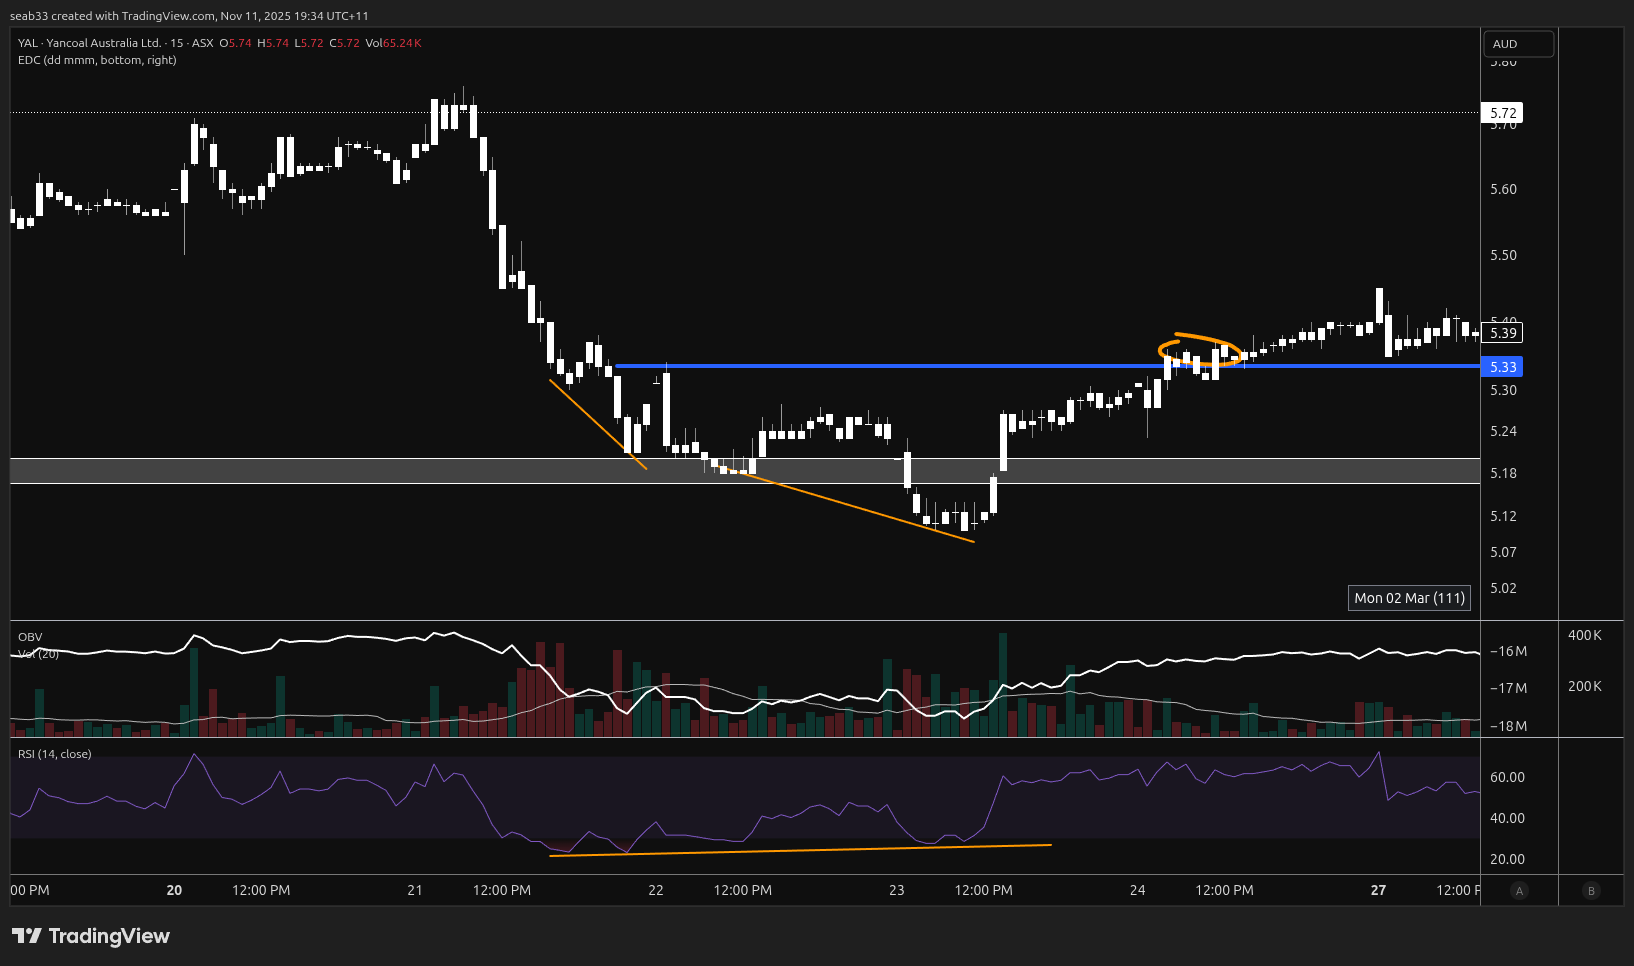
YAL
Summary
- Liquidity grab
- Bullish div on the RSI
- OBV didn't confirm new low
- OBV rose when price was rising back out of liquidity grab
Entry

Big picture there was a liquidity grab on the 23rd of oct (last wick down)
Looking closer at the liqudity grab, there was bullish div on the rsi, OBV barely confirmed the new low and on the way up, OBV confirmed the move on the way up
OBV zoomed in
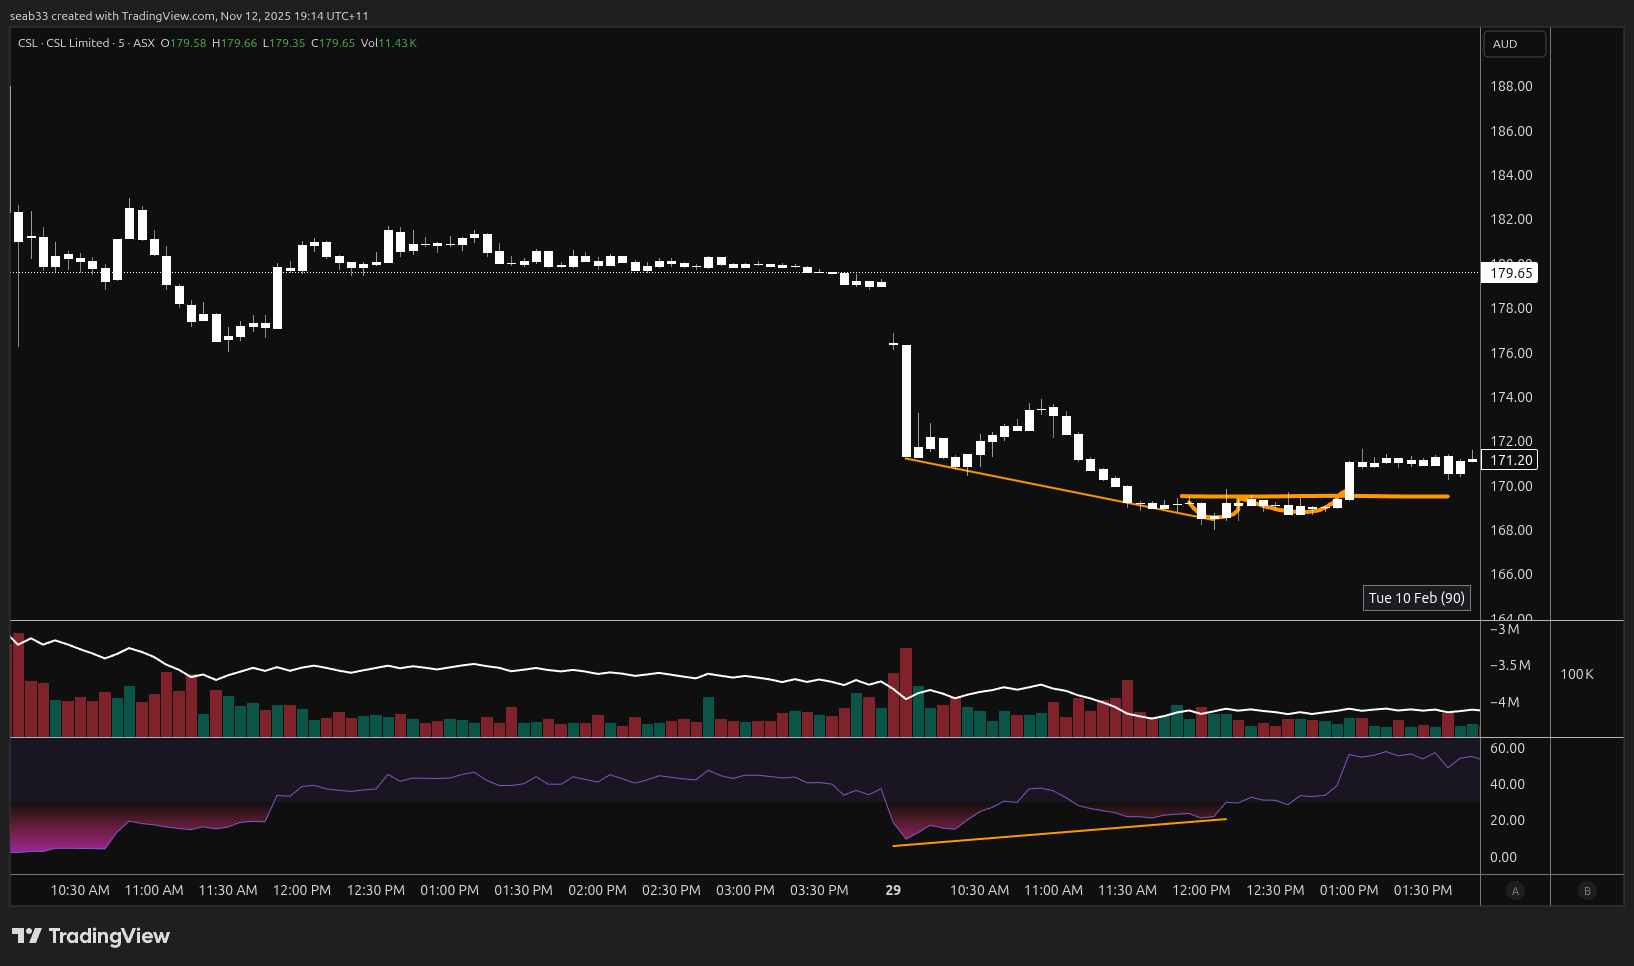
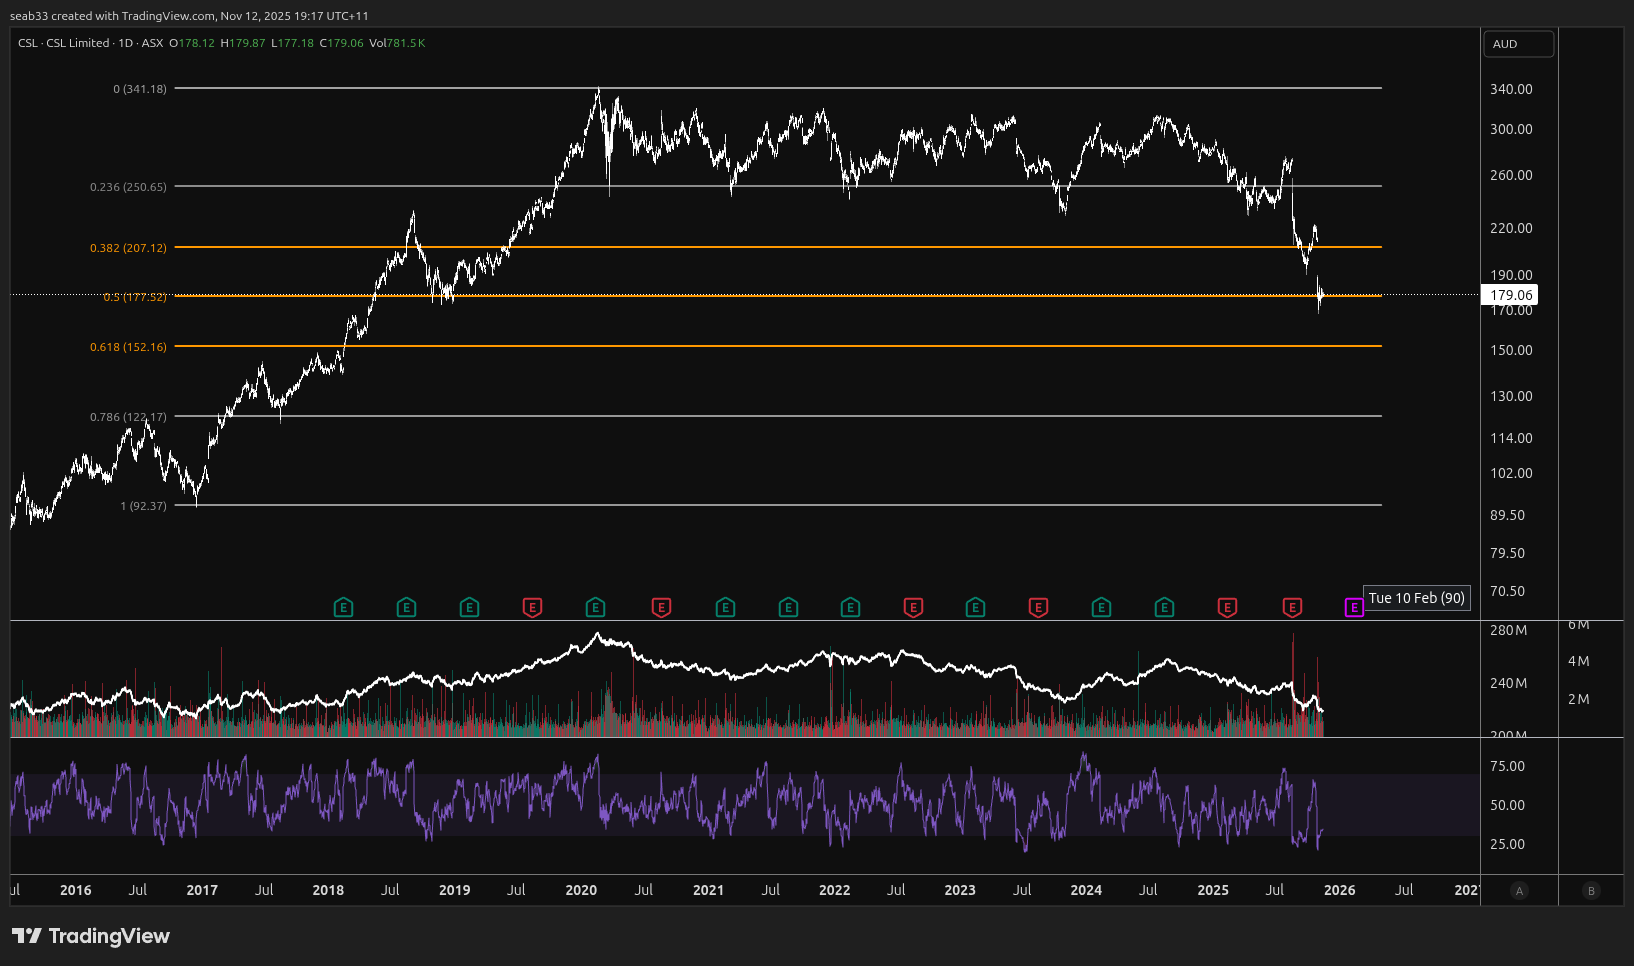
CSL
Summary
- Bullish div on RSI
- COMS
- Bounce at long term support
- Right at .5 fib zone
On the 5 min, we can see the bullish div on the RSI before the COMS
On the BIG timeframe, there was:
- Long term support
- Was right at the .5 fib zone on the log chart
Main reasons for entry
General
- COMS
- Break through diagonal trend line
- Support turned into resisistance, now broken back through (BTC 2023 bottom)
- Patterns
- Falling wedge
- Market structure (HH - HL)
- Bullish div on RSI
- OBV supporting move
- Indicies not confirming a low (HH on eth, while LL on BTC) / (gold breaking up, buy gold miner but use gold price as decisions)
- Price at fib zone
- Price at moving average
- Sector breaking up out of accumulation, stonk showing signs of a bottom (AGL & Utilities 2021)
Crypto specific
- BTC pair must also be following price
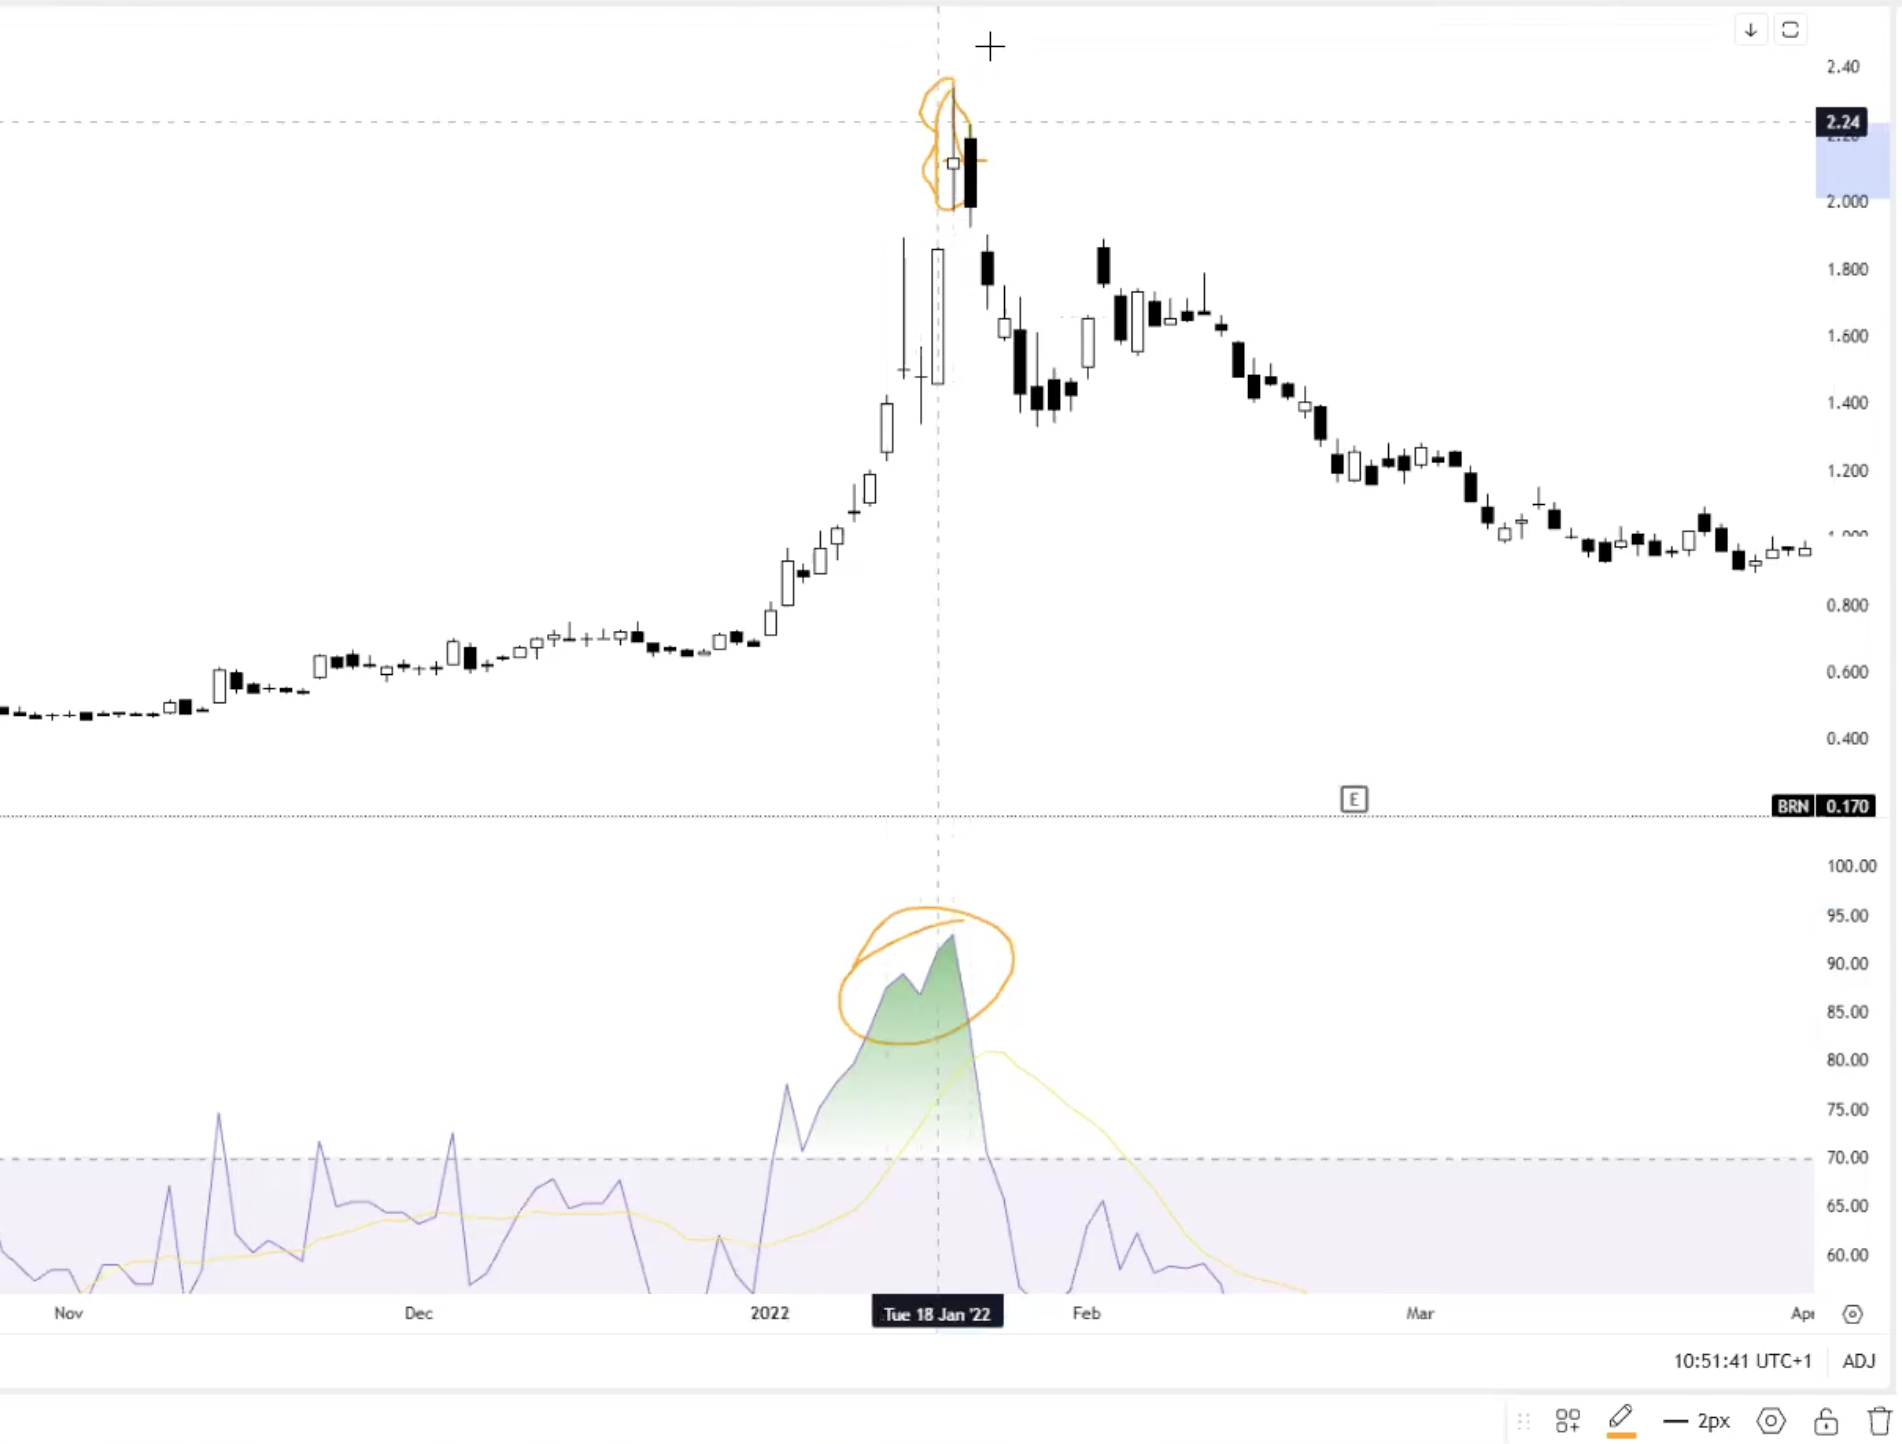
BRN
Summary:
- Price gapped into RSI bearish divergence
- Doji - Indecision candle, followed by a bearish candle
- Gap up was filled within 1-2 days (extrely bearish)
- Island reversal (gap up and gap back down leaving an island)
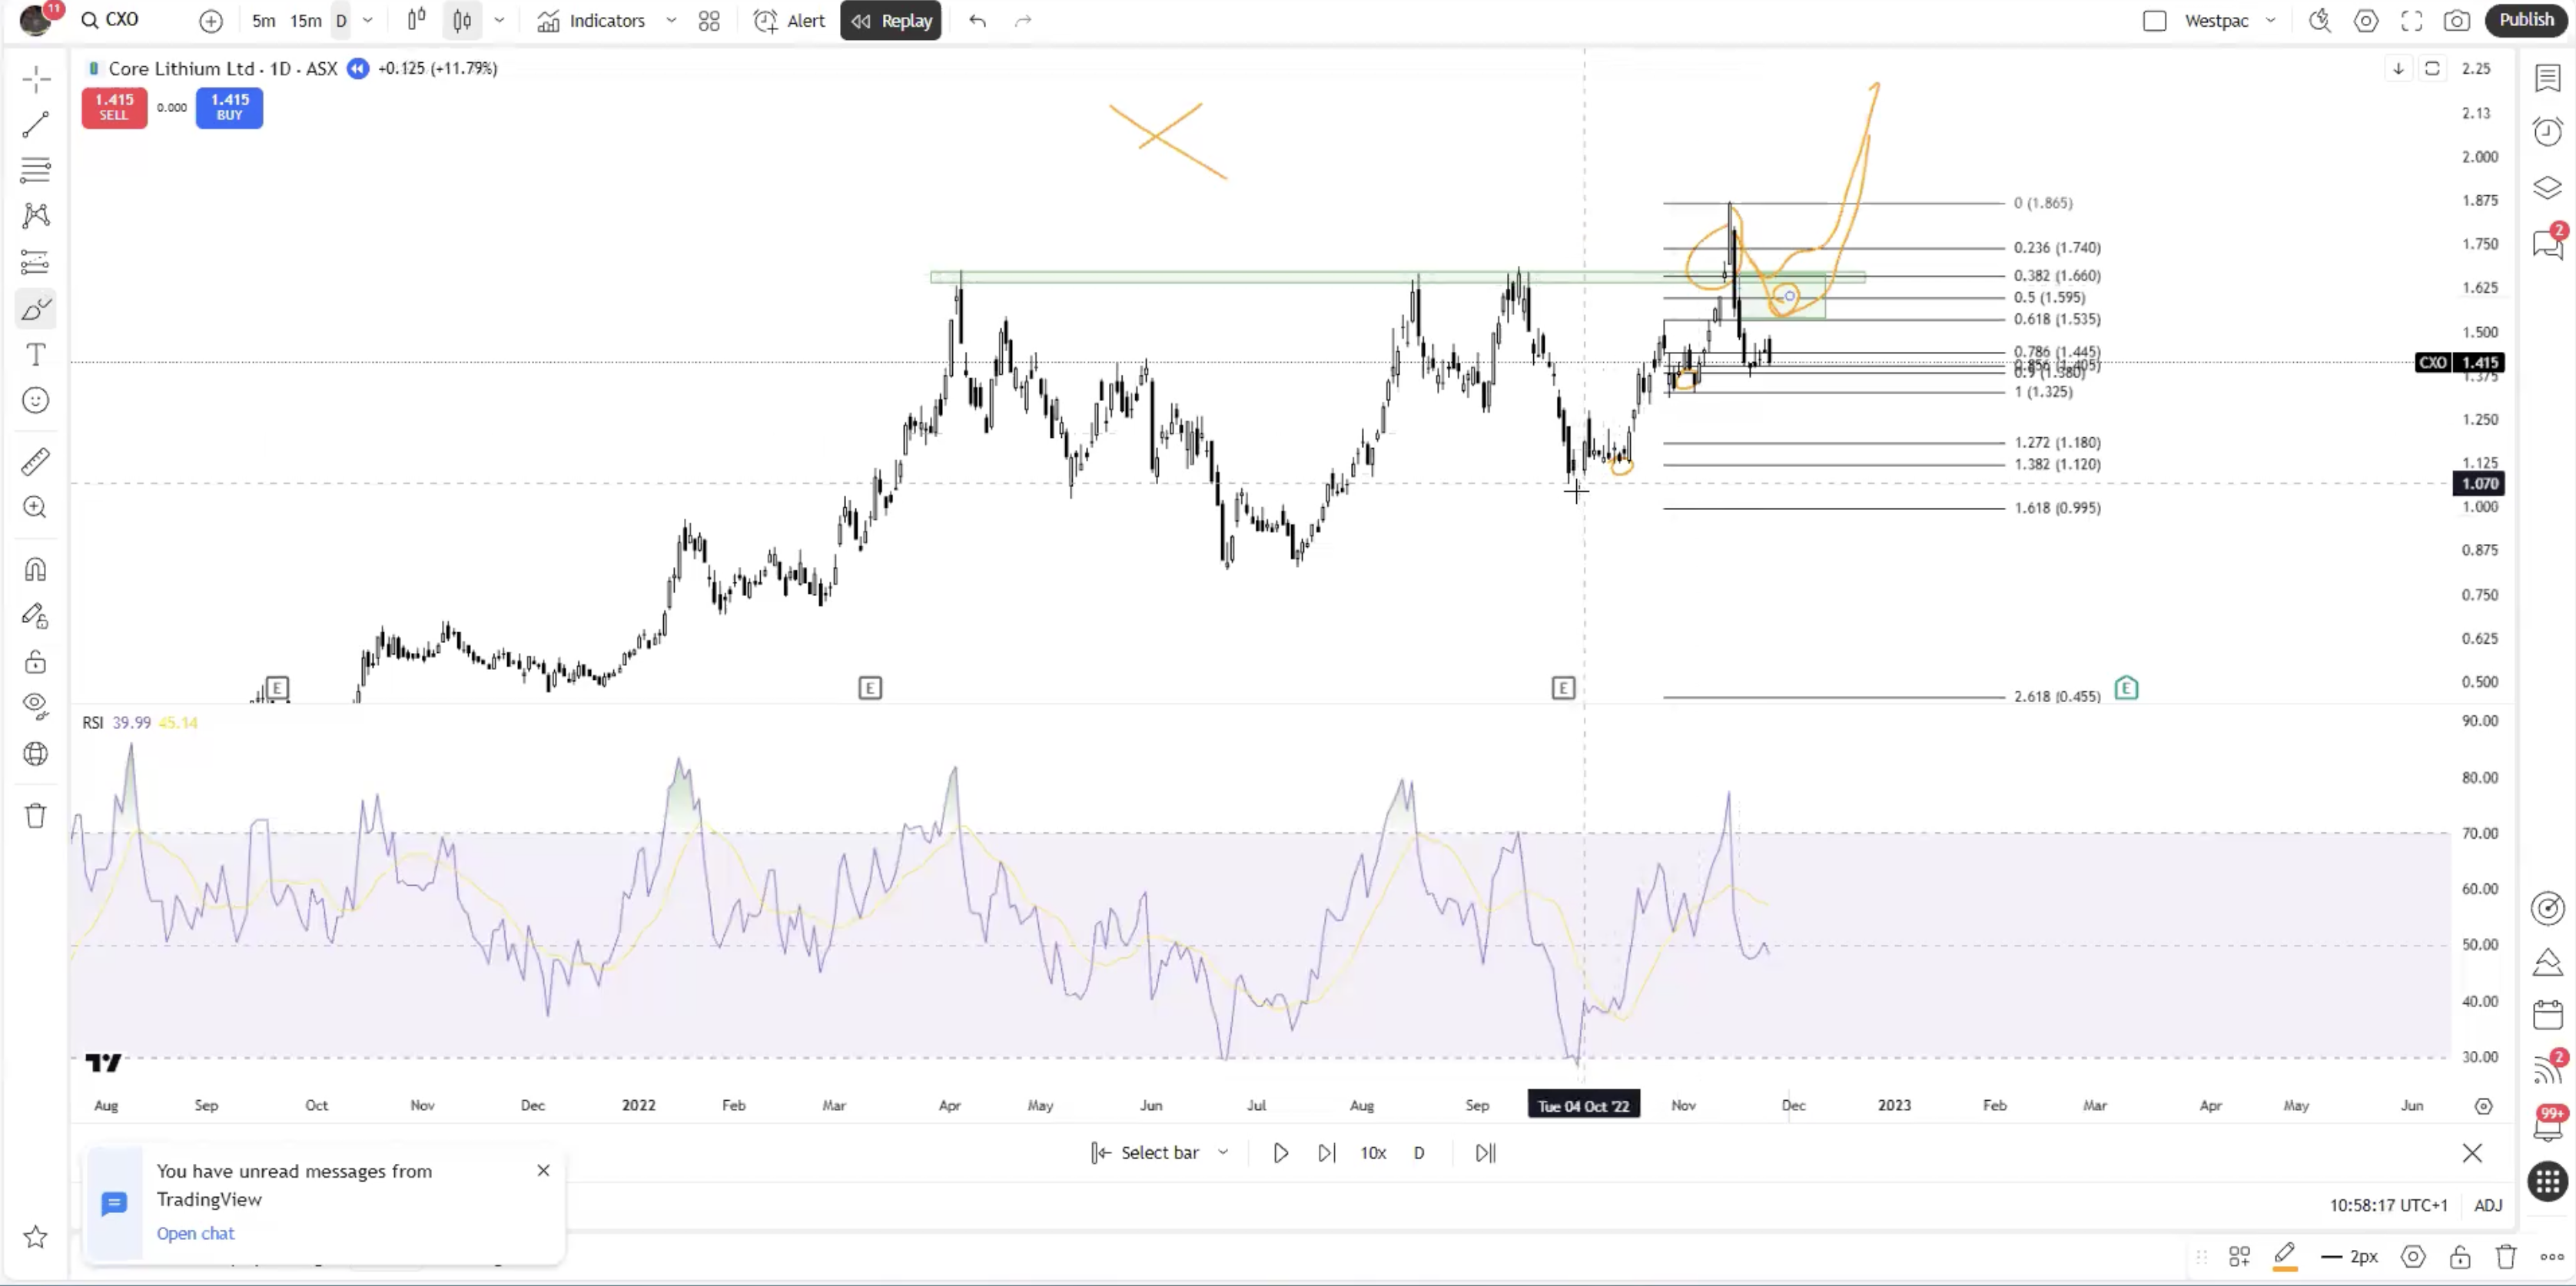
CXO
Summary
- Previous zigs and zags bouced off the zag zone (good sign of continuation), next push up and back down did NOT buy off the zag zone and just fell thought
- Break support for two reasons - grab liquidity or continue the trend. If it broke up and right back down this would most likely NOT be to continue the trend
- Exhaustion gap filled quickly
- Gapped into bearish divergence on the RSI
- Price made a new high but OBV didn't make a new high
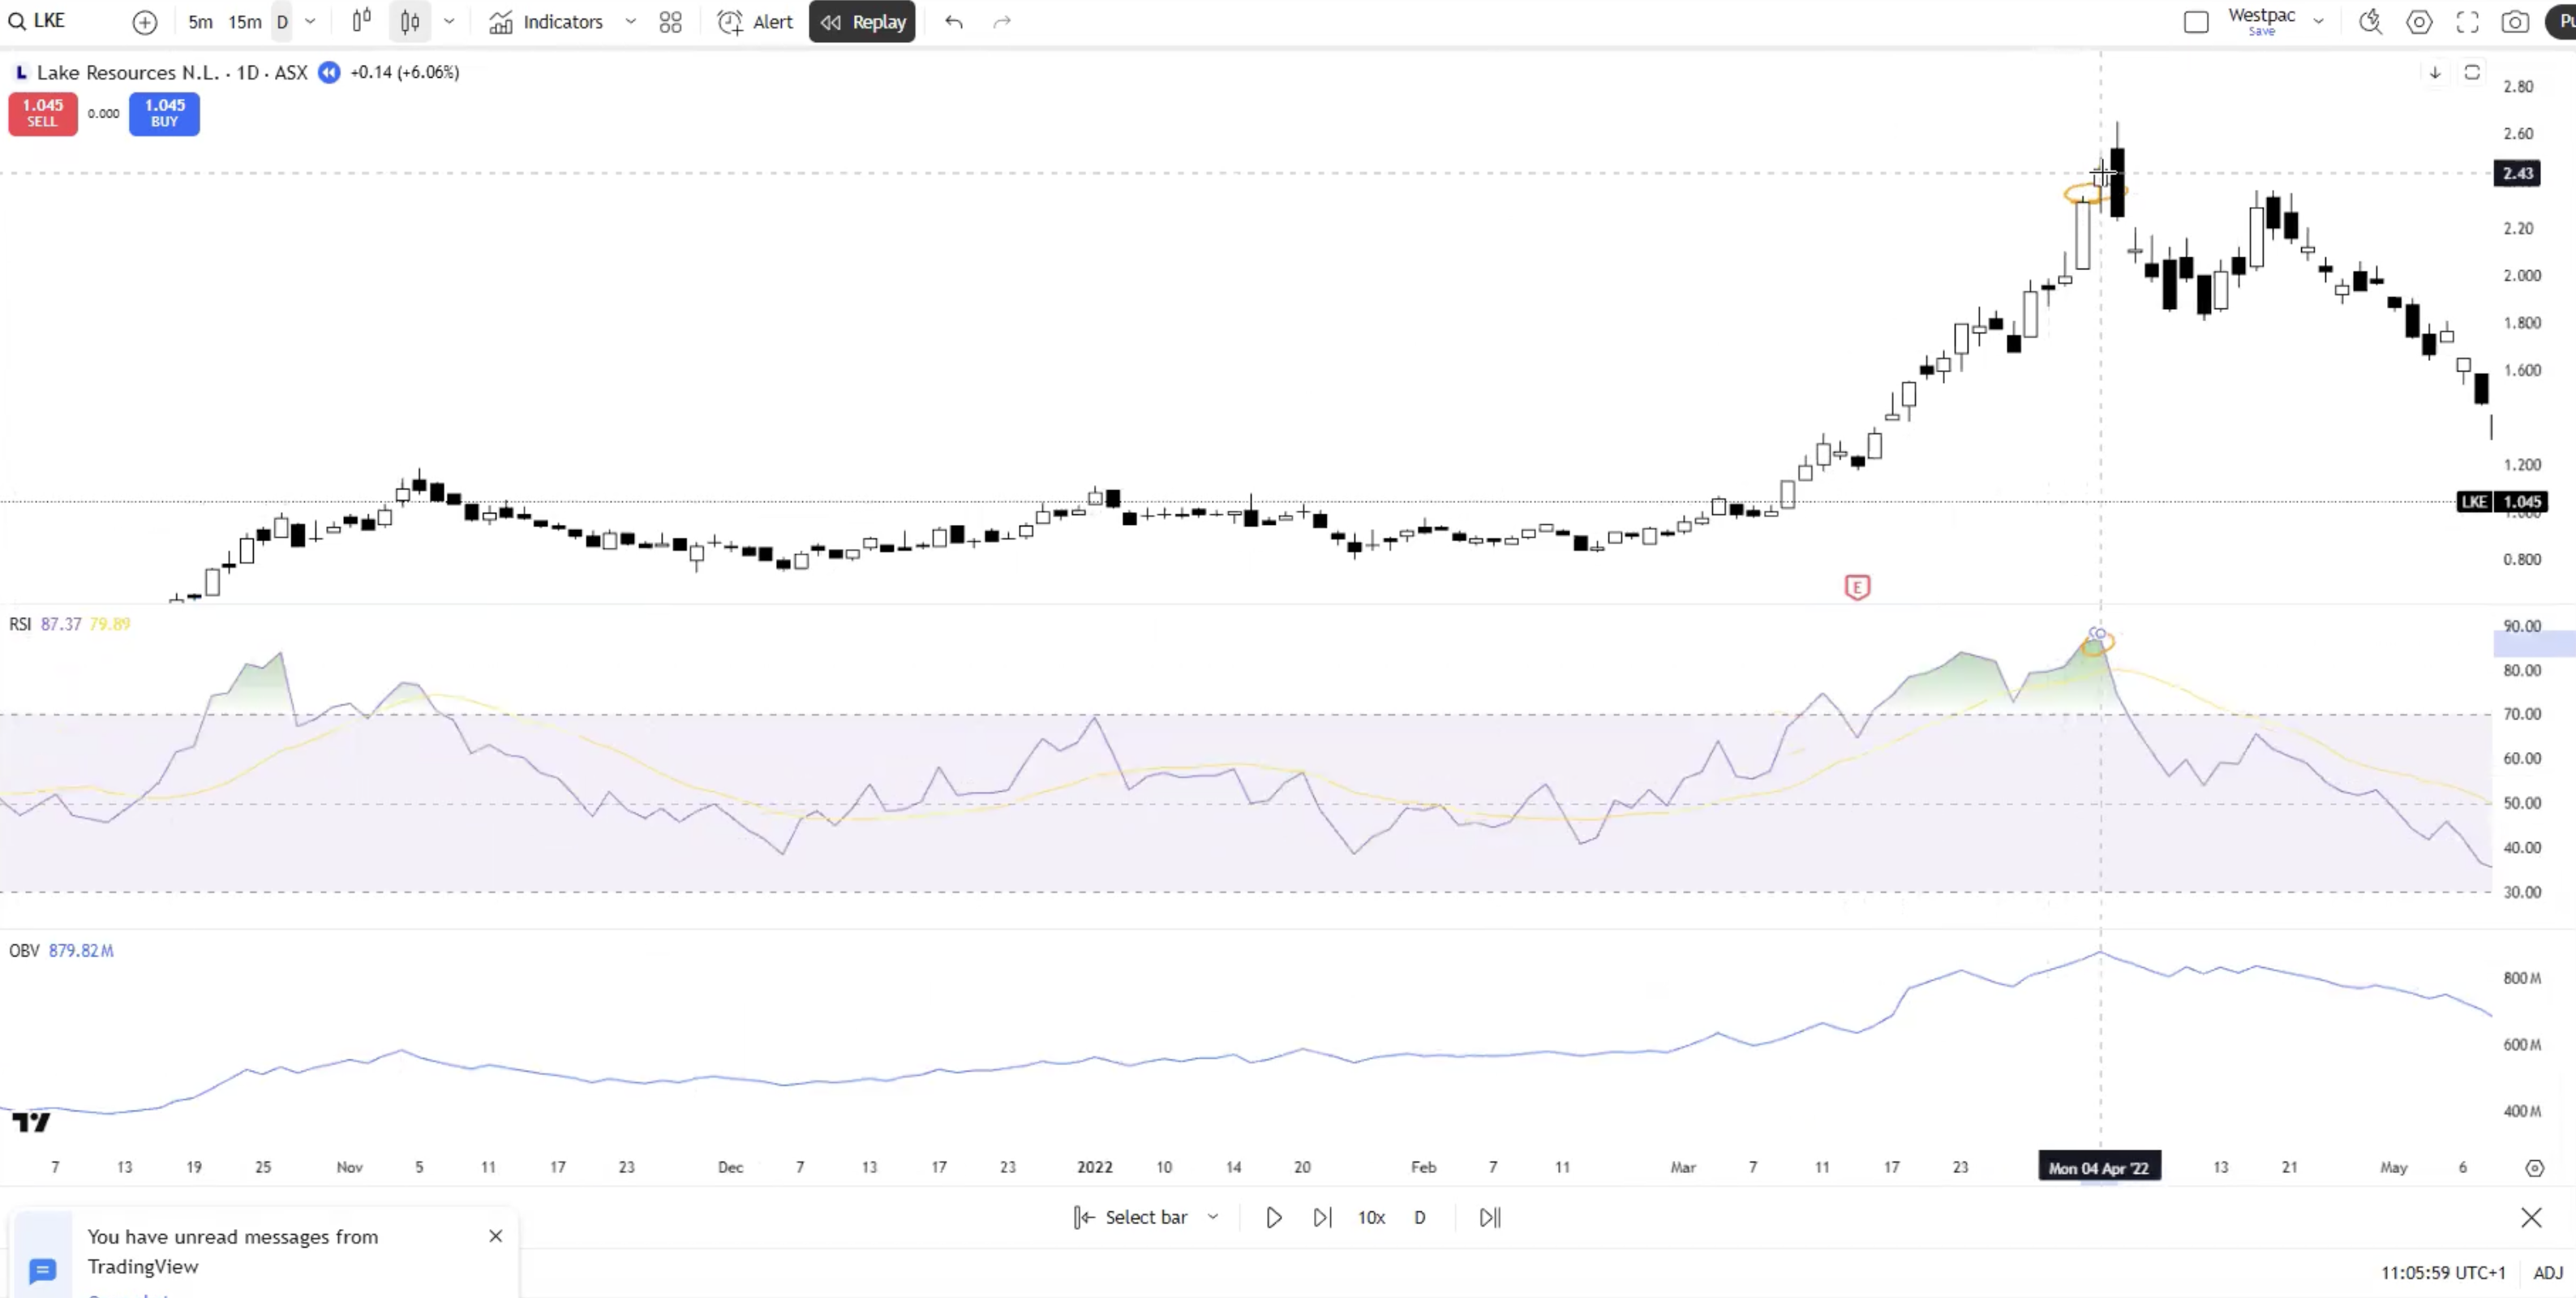
LKE
Summary
- Big green candle into an indecision candle (doji) followed by big red candle that wipes out all gains (bearish)
- Bounced back into the zag zone and fell back down (bearish)
- COMS
- Gap up (body closes, not wicks) - exhaustion gap that was filled 1-2 days later (bearish)
- Gap into overbought RSI
- Did a 100x in 2 years
- Hit the 1.618 extension
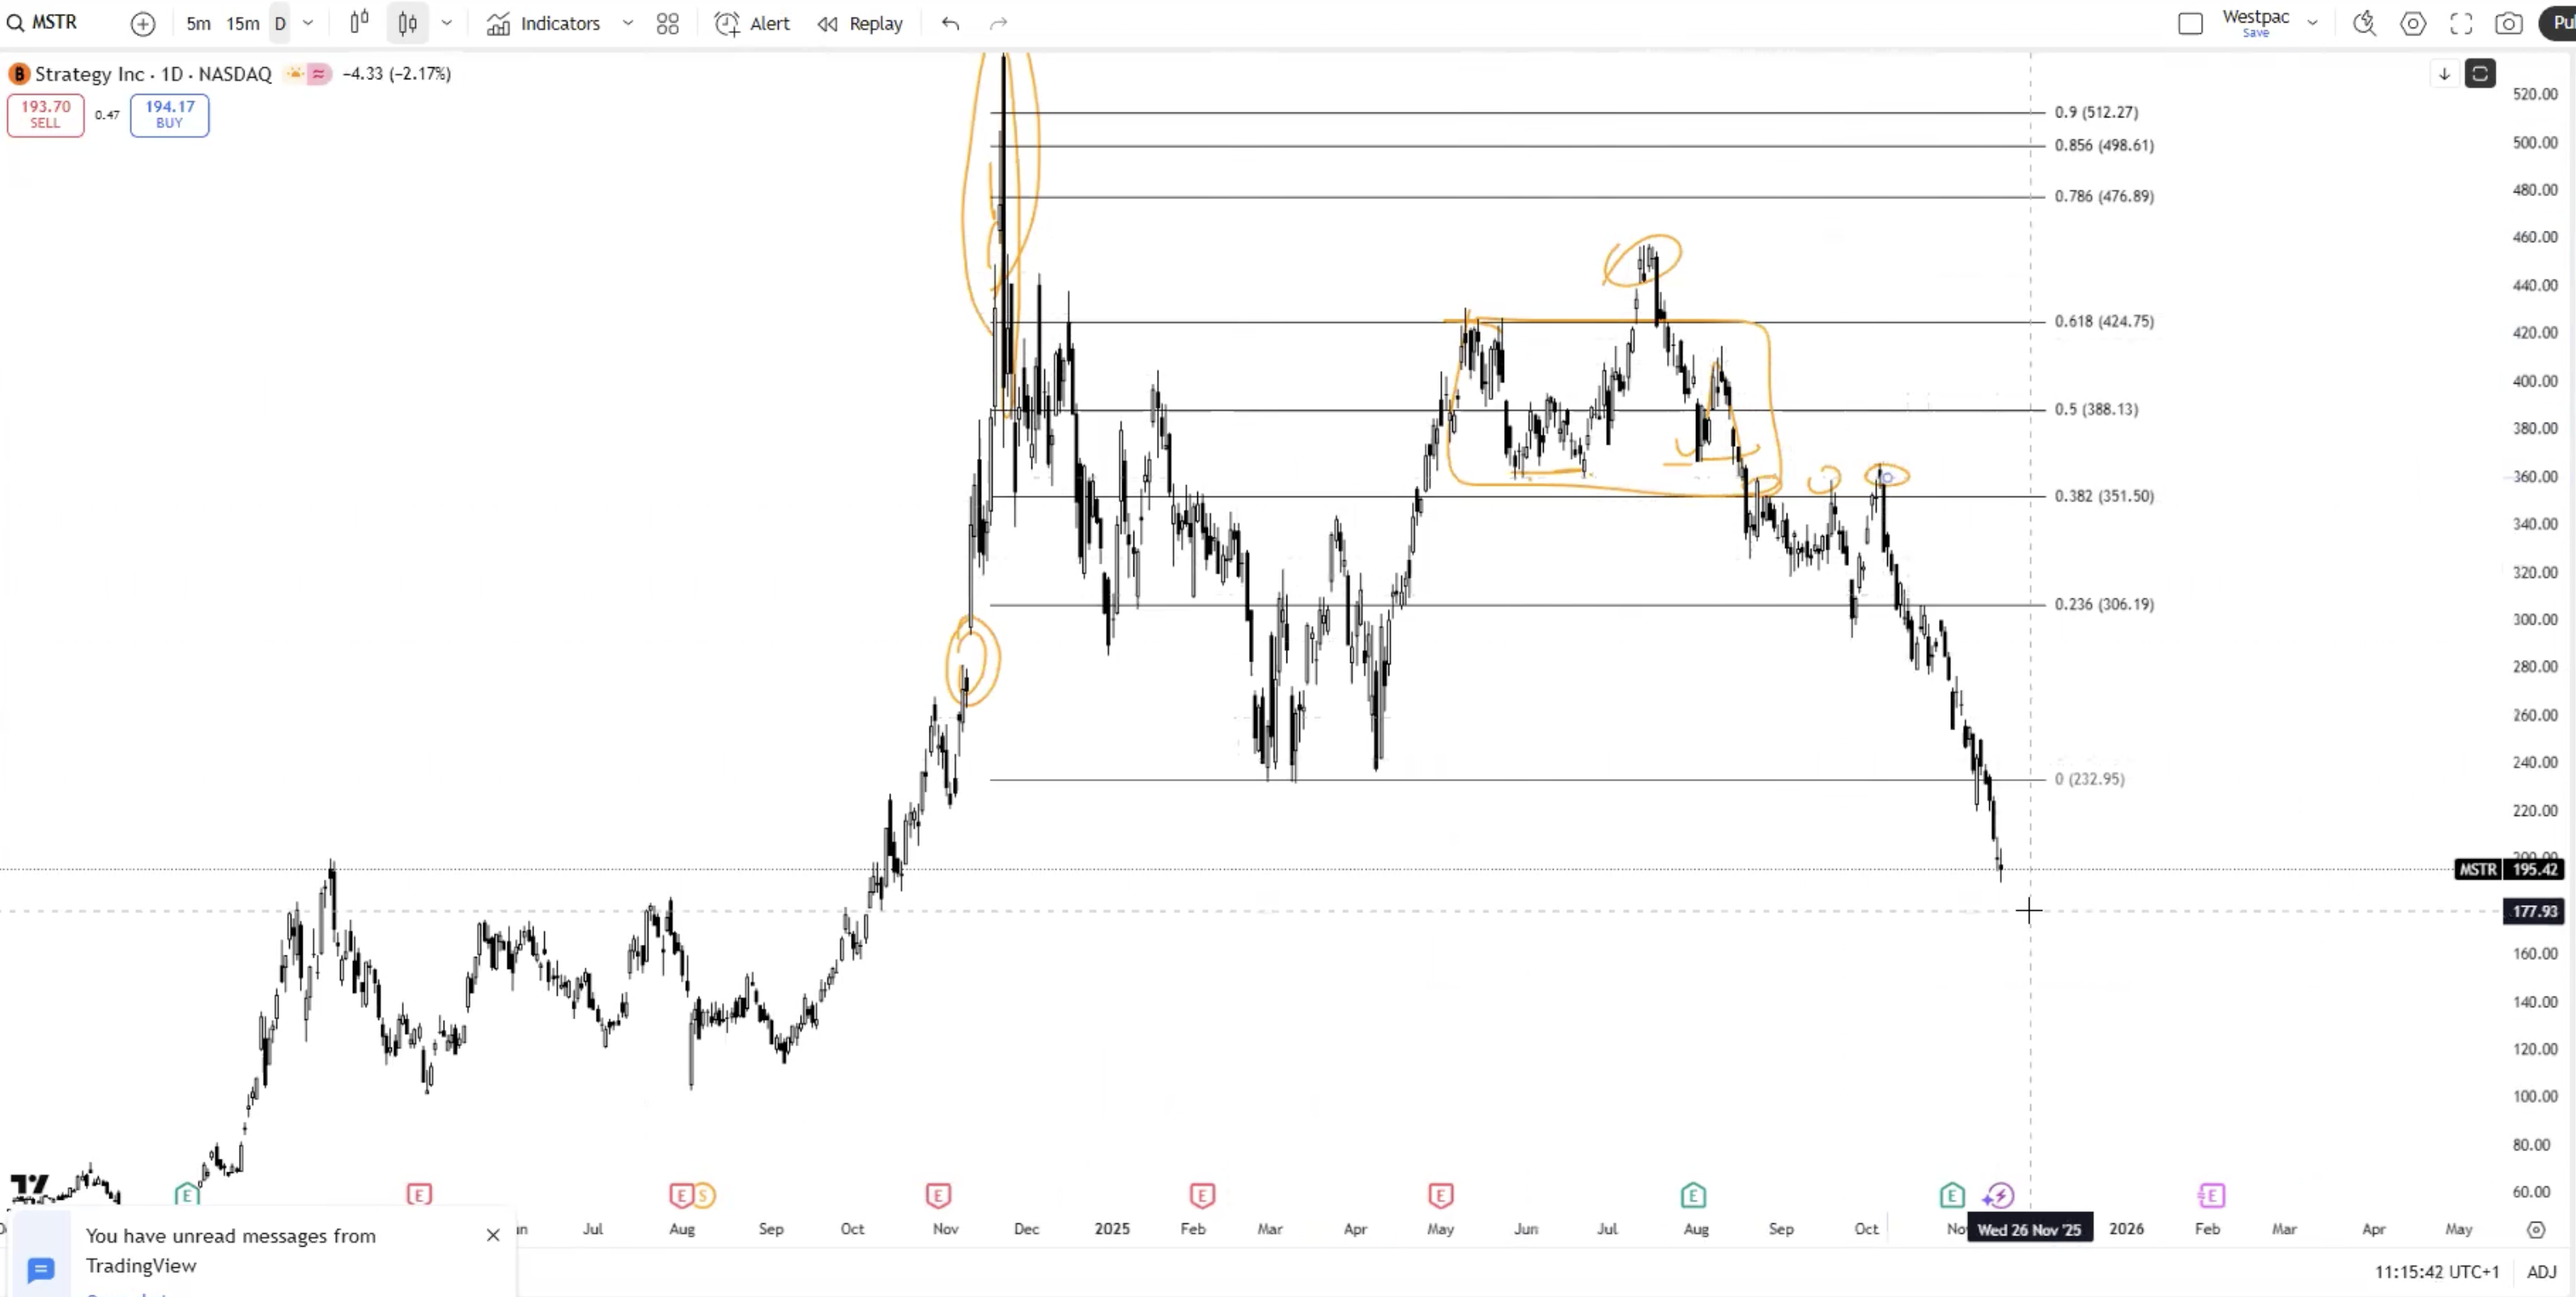
MSTR
Summary
- Blow off top
- Exhaustion gap filled within 1-2 days
- Bounced back into the 0.618, quick push above then fell back down (break support for two reasons... to grab liquidity or continue the trend)
- Area that was support is now resistance