RSI Divergence as a leading Indicator
What Is RSI?
The Relative Strength Index is a price momentum indicator — it measures price momentum only, nothing to do with volume. RSI is bounded between 0 and 100, like an elastic band that gets stretched between extremes and always snaps back.
Overbought & Oversold
- Above 70 = overbought. Above 80 = really overbought
- Below 30 = oversold. Below 20 = really oversold
- Between 30-70 = neutral
- RSI is considered "reset" when it moves from one extreme to the other (e.g. 70 down to 30)
Critical rule: Just because it's overbought doesn't mean it can't go higher. Just because it's oversold doesn't mean it can't go lower. Some of the BIGGEST moves happen when RSI is overbought or oversold. Don't sell just because it's overbought or buy just because it's oversold — that's using RSI as a lagging indicator and will get you wrecked.
RSI Reset Timing by Timeframe
- Hourly: Can reset from overbought to oversold within a single day
- Daily: Takes a few weeks of significant movement to reset
- Weekly: Can take several months (6+ months) to move from oversold to overbought
- A small pullback with a pivot is enough to reset RSI and allow the next leg up/down — the pullback doesn't have to be huge
How to Add RSI in TradingView
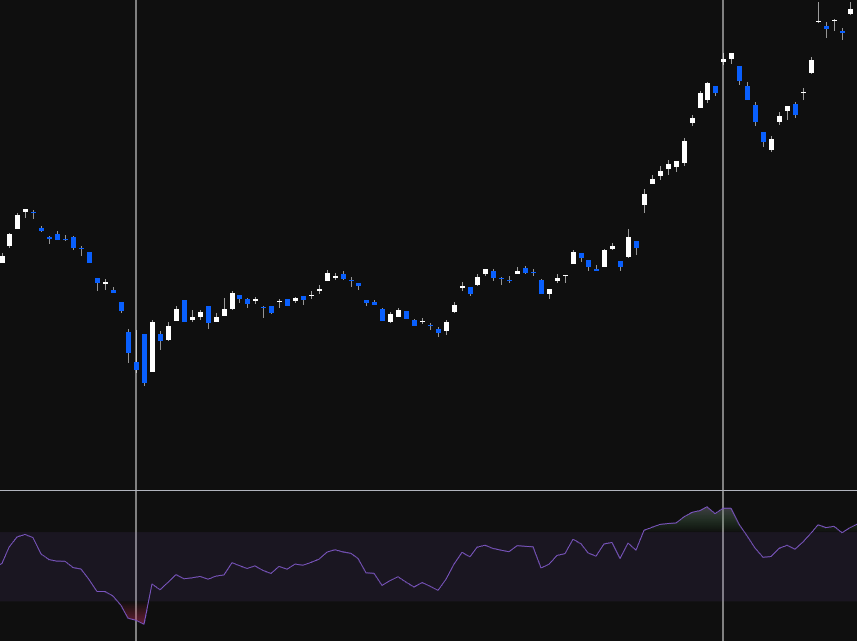
Indicators → search "RSI" → Relative Strength Index → add. Appears as a bounded chart below the price chart.
What Is Divergence?
Divergence is when price and the indicator (RSI) are going in opposite directions. It warns that the current price trend may be weakening and in some cases may lead to a reversal.
The running analogy: When you go for a run, at first you have all the energy and momentum. Over time, your body starts giving you signals — puffing, sweating, needing water — that you're weakening. Eventually you'll need to stop. The market works the same way. A trend is running strong, then RSI starts giving signals that momentum is fading. It doesn't mean the trend stops immediately, but it's warning you.
Using RSI for Divergence = Leading Indicator
If you use RSI for overbought/oversold, it's a lagging indicator (telling you what already happened). If you use RSI for divergence, it becomes a leading indicator — signalling what's likely to happen in the future. Every indicator the educator teaches is a leading indicator, because you can't make money on the past.
Divergence Can Mean Two Things
- Reversal — the trend actually reverses
- Range/Consolidation — price goes sideways to "chill" before continuing
Divergence does NOT always mean a reversal. It signals that something is changing, and the trend may consolidate OR reverse.
Two Types of Regular Divergence
| Bullish Divergence | Bearish Divergence | |
|---|---|---|
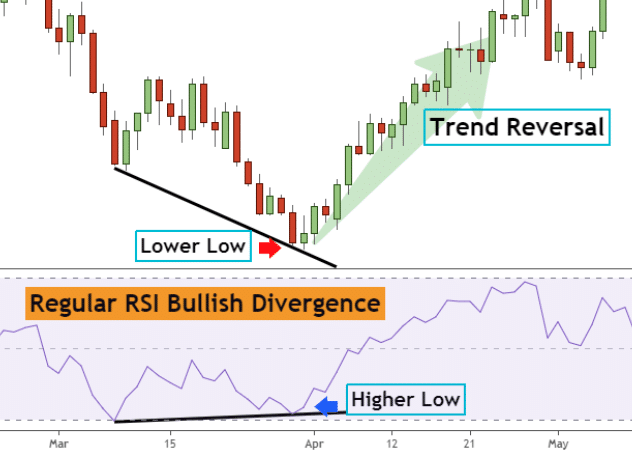
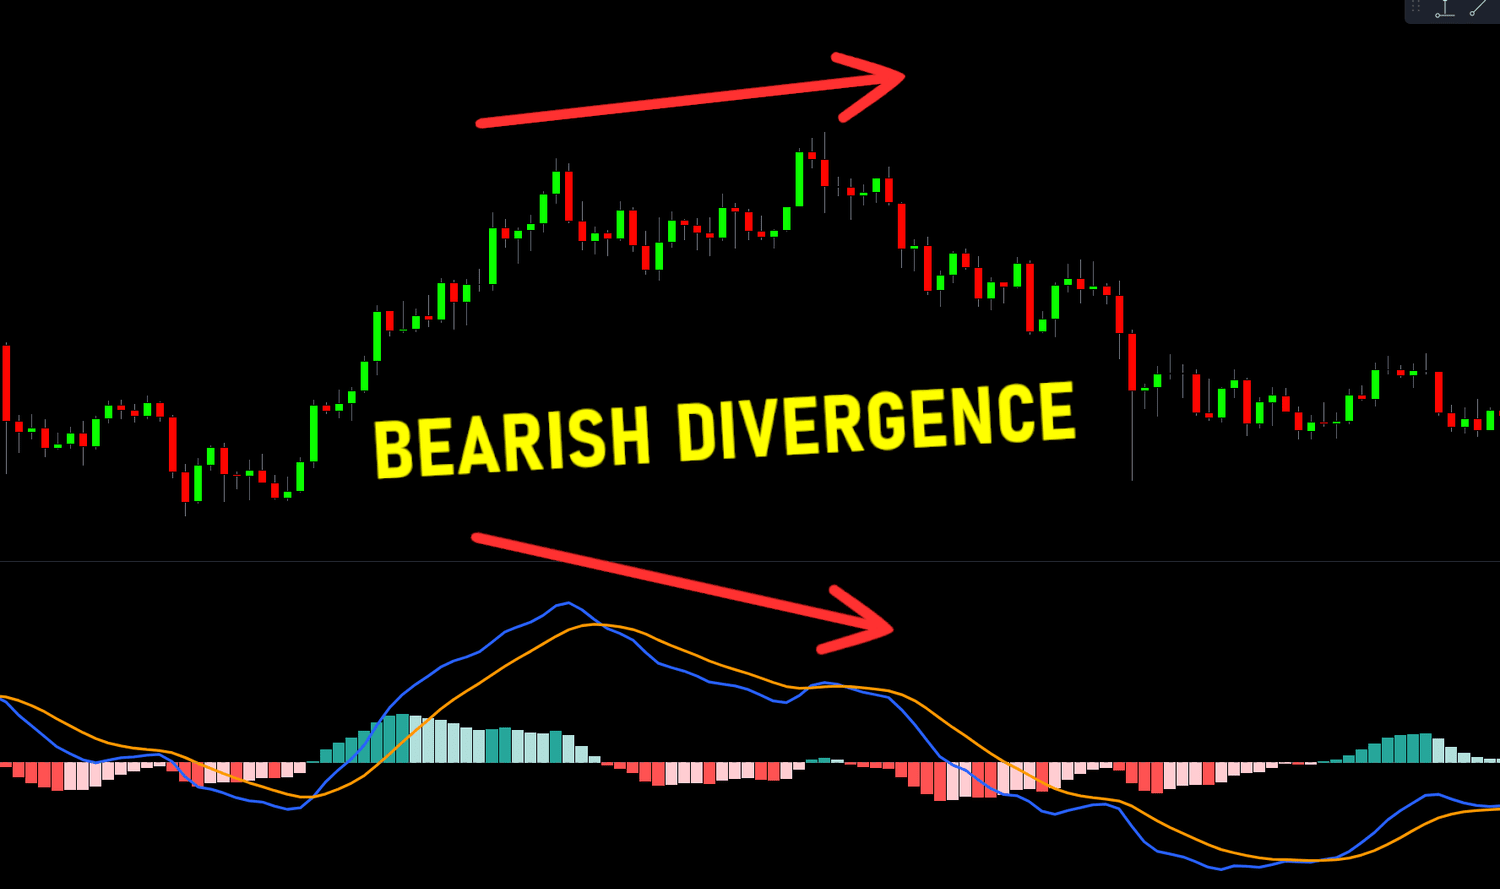
| Price | Makes a lower low | Makes a higher high |
| RSI | Makes a higher low | Makes a lower high |
| Meaning | Downtrend momentum weakening — potential reversal upward | Uptrend momentum weakening — potential reversal downward |
| Where found | Only at bottoms (in downtrends) | Only at tops (in uptrends) |
You can only look for bullish divergence in a downtrend (because you're looking for the bottom). You can only look for bearish divergence in an uptrend (because you're looking for the top). You can't find bearish divergence in a downtrend — it doesn't exist there.
Divergence Strength
There are three strengths of divergence — strong, medium, and weak. Strong divergences most often lead to major reversals. Weak divergences usually just produce a bounce.
Strong Divergence
- Bullish: Price makes a lower low, RSI makes a higher low
- Bearish: Price makes a higher high, RSI makes a lower high
- Most reliable — often leads to confirmed reversals
Medium Divergence
- Bullish: Price makes a double bottom (equal low), RSI makes a higher low
- Bearish: Price makes a double top (equal high), RSI makes a lower high
- Example: ASX Trader's Ethereum entry at ~$60 was based on medium bullish divergence (double bottom on price, higher low on RSI) + change of market structure through support
Weak Divergence
- Bullish: Price makes a lower low, RSI makes a double bottom (equal low)
- Bearish: Price makes a higher high, RSI makes a double top (equal high)
- Least reliable — more often leads to just a bounce followed by continuation, rather than a full reversal. Be careful if it rejects and keeps going
Steps to Find and Confirm Divergence
Step 1: Identify the Swing Points
Connect two low points on price (A and B). Then find the corresponding two swing lows on RSI. Are they going the same direction or opposite? If opposite = divergence.
Use the vertical line tool to match price pivots with RSI pivots — ensures you're looking at the right corresponding points.
Step 2: Assess Divergence Strength
Is it strong (lower low / higher low), medium (equal low / higher low), or weak (lower low / equal low)?
Step 3: Wait for Confirmation — DON'T Trade the Signal
Divergence alone is NOT an entry signal. It's an early warning. You need price action confirmation:
- A reversal pattern (failure swing, non-failure swing, double bottom)
- A change of market structure (HH/HL)
- A breakout through resistance or trend line break
- Even better: a combination of multiple confirmations
Step 4: Trade the TRIGGER, Not the Signal
The blinker analogy: Divergence is like a car's indicator/blinker. It signals the car is going to turn. But if you drove based on blinkers alone, you'd have an accident within a week — people put blinkers on wrong, too early, or not at all. Same with divergence. Sometimes the first divergence leads to a reversal. Sometimes it's the second, third, or fourth. You wait for the car to actually turn (change of market structure) before you act.
Signal = divergence. Trigger = change of market structure / reversal pattern / breakout. We trade triggers, not signals.
Do's and Don'ts for Drawing Divergence
Do's
- Draw divergence lines on extremes only (clear pivot points). The sharper the extreme, the better
- It's desirable for the first RSI extreme to be in the overbought or oversold zone (not in the middle of the range). Divergence from an extreme is more powerful
- The bigger the angle between the price line and the RSI line, the stronger the divergence
- Draw lines on candle bodies, not wicks — RSI follows bodies, not shadows
- Be consistent: if you connect two highs on price, connect the two corresponding highs on RSI. Use vertical lines to verify alignment
- Longer timeframes produce more reliable divergence. Monthly and weekly have fewer false signals than daily or hourly. Weekly divergence that builds over months signals something big (e.g. the S&P weekly bearish divergence before Trump tariffs and before COVID)
- Divergence isn't confirmed until a pivot is in. Until then, it's just potential divergence. You need the RSI to actually pivot for the divergence to be valid
- You can only count divergence after a "reset." RSI needs to have gone from one extreme to the other before you can start counting new divergence
Don'ts
- Don't trade divergence alone — wait for the trigger (price confirmation)
- Don't expect hourly divergence to produce a weekly-level reversal. Match your expectations to your timeframe
- Don't use multiple indicators that measure the same thing (e.g. RSI + MACD + Stochastic RSI = all price momentum). That gives you confirmation bias, not confirmation. They're all telling you the same thing in different ways
- Don't try to pick the exact top or bottom off divergence. "The glamour of wanting to pick the top or bottom is more about ego than profits"
Combining RSI with OBV
RSI measures price momentum. OBV measures volume momentum. These are different things, so using both is valid (unlike RSI + MACD which are both price momentum).
The ideal setup: RSI divergence confirmed by OBV divergence = two different signals both pointing the same direction. Enter on the change of market structure, hold until you get the opposite signal from either RSI or OBV.
This is what confluency means — multiple independent signals all telling you the same thing. The more confluency, the higher probability the trade works.
Craig's Key Insight: News Creates Catalysts for Moves That Were Already Due
The S&P 500 showed significant bearish divergence on the weekly timeframe before both the Trump tariff sell-off and COVID. The divergence was already signalling weakness — the news event just created the catalyst that expedited the pullback. "We were always going to pull back. The catalyst of the news made it happen much quicker."
This is why divergence is so powerful as a leading indicator — it shows you the setup before the trigger event occurs. By the time the news hits, the weakness was already there for weeks or months.