1.5 - Mastering (RSI) Divergence as a leading Indicator
RSI
RSI is a price momentum indicator with reading of overbought and oversold
- Areas below 30 suggest oversold and areas above 70 suggest overbought
- The RSI is considered "reset" when it goes from one extreme to the other (70 to 30)
Divergence
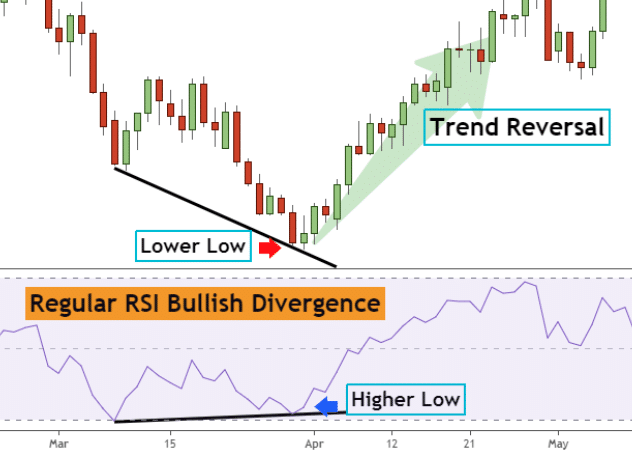
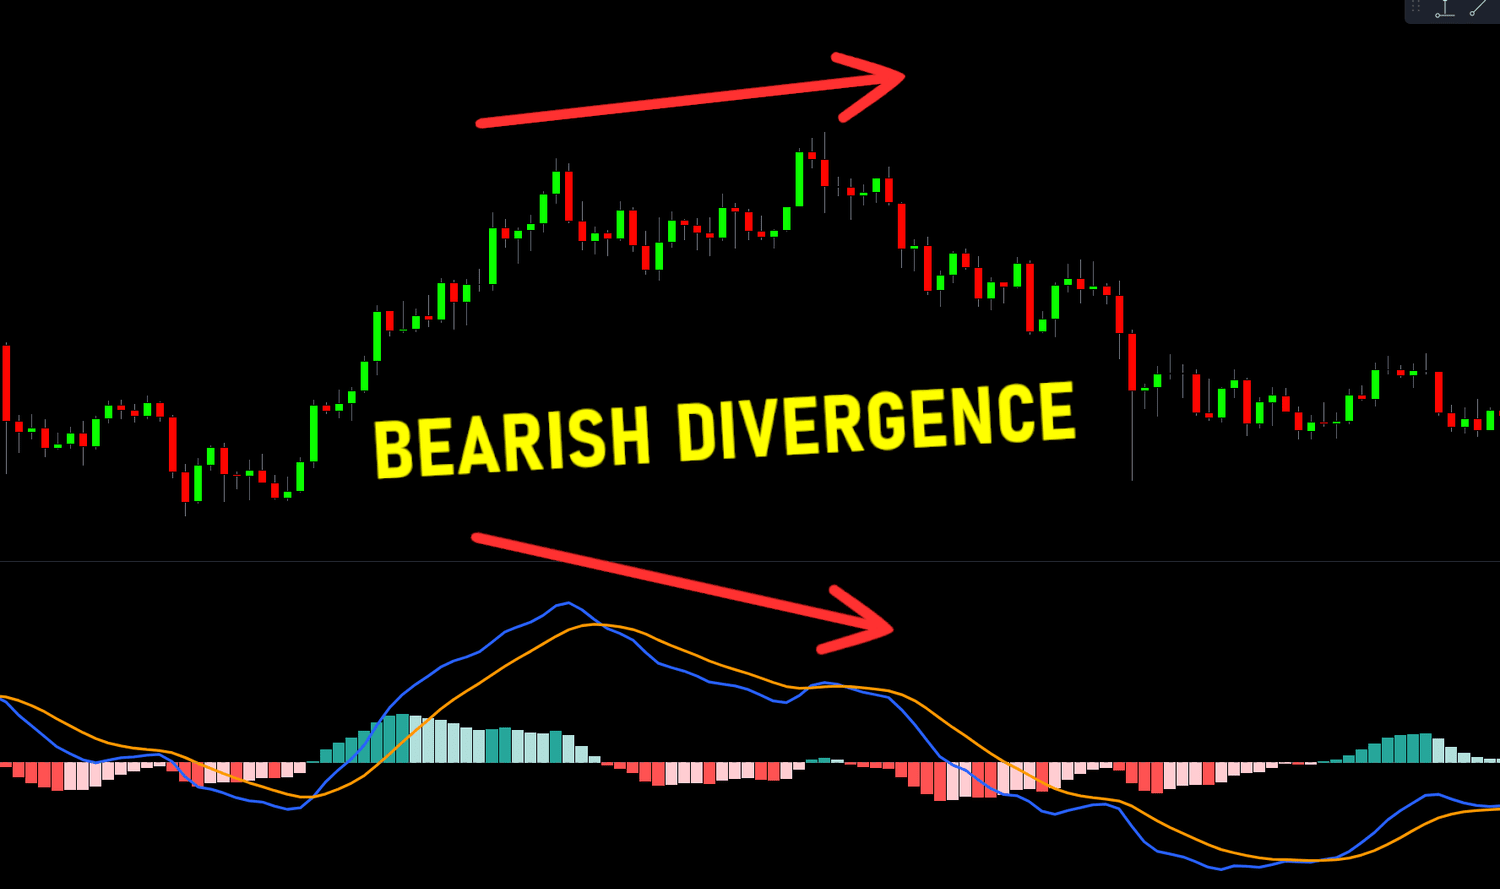
- Divergence is when the price and indicator show different structures.
- Bullish divergence increases the probability that a reversal will happen with more force and shouldn't just go sideways
- When looking for divergence, you can only count it after a "reset"
- Divergence isn't confirmed until a pivot is in, until then it's just potential divergence
| Bullish divergence | Bearish divergence |
|
|