
Candlestick & Pattern Analysis
CandlesCandlestick analysis
& Pattern Analysis
What Type of Trader Are You?
Before diving into candlesticks, you need to know which timeframe suits your personality. The candles you look at depend entirely on your trading style.
| Style | Timeframe | Hold Period | Risk | Reward | Stress | Best For |
|---|---|---|---|---|---|---|
| Months to years | Low | Low (slow) | Low | Long-term investors, relaxed personality | ||
| Swing
|
Daily
|
Days to weeks/months | Low-Med | Medium (takes time) | Low-Med | Patient traders, don't need daily results |
| Day
|
5min
|
Within the day | Med-High | Higher (faster) | Higher | People who thrive on pressure |
|
1min
|
Minutes to hours | High | High (immediate) | Very High | Adrenaline lovers, decisive under pressure |
Key insight: Your personality determines which style works. If you love roller coasters and spontaneity → scalping/day trading. If you prefer the beach and reading → swing/position trading. The educator started as a day trader (loved the rush, got fast feedback for learning), then transitioned to position trading as his life and priorities changed.
Match your chart timeframe to your style: Position trader = weekly/monthly. Swing trader = daily/weekly. Day trader = daily/hourly. Scalper = 1min/5min.
Anatomy of a Candlestick
Each candle gives four pieces of data: Open, Close, High, Low.
- Body = range between open and close
- Wicks/Shadows = the high and low extremes the price reached during the period
- Green/White = closing price was HIGHER than opening price (bullish)
- Red/Black = closing price was LOWER than opening price (bearish)
Multi-timeframe unpacking: A single daily candle can be unpacked by looking at the hourly/5min charts within that day. A bullish engulfing on the daily might show a clear downtrend reversal on the hourly. A bearish shooting star on the daily might show a strong downtrend on the 1-minute. This helps you understand what's actually happening inside each candle.
Candlestick Patterns
Reference Charts
| Bullish | Bearish |
|---|---|
 |
 |
 |
 |
 |
 |
No pattern works all the time — they represent tendencies, not guarantees. Always confirm with volume and other indicators.
PatternSingle analysisCandle Patterns
PatternsMarubozu ("Bald Head"): No or minimal wicks — open/close IS the high/low. Bullish marubozu = intense buying pressure throughout the session. Bearish marubozu = intense selling pressure. These are formationspowerful trend confirmation candles.
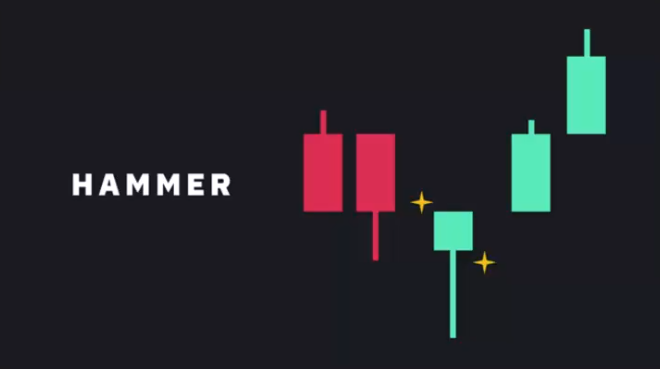
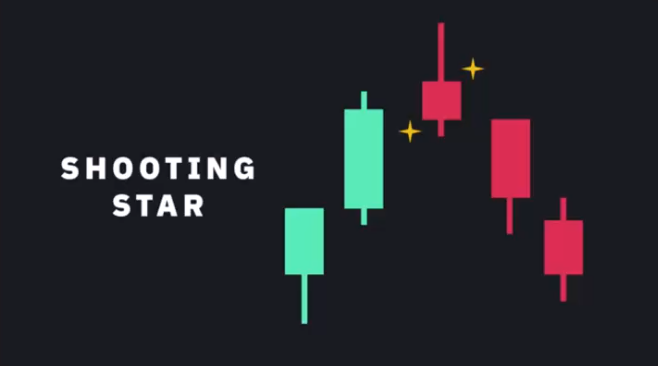
Hammer / Shooting Star: Long wick at one end, small body. Hammer (bullish) = long lower wick at bottom of downtrend, buyers stepped in hard. Shooting Star (bearish) = long upper wick at top of uptrend, sellers pushed price back down. Can be either colour.
Spinning Tops / Dojis: Short body centered between long upper and lower wicks. Neutral — represents indecision between bulls and bears. What matters is the candle that appearfollows: big green after a doji = bulls won. Big red = bears won.
Multi-Candle Patterns
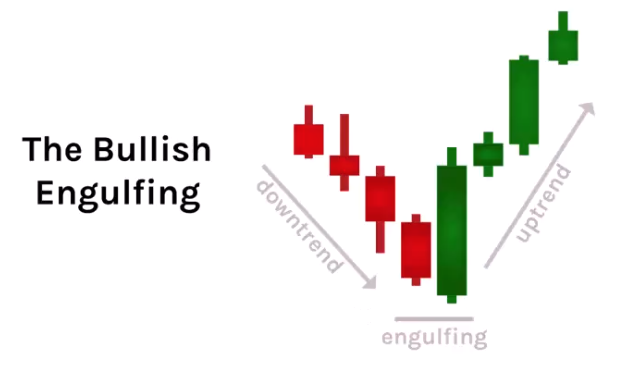
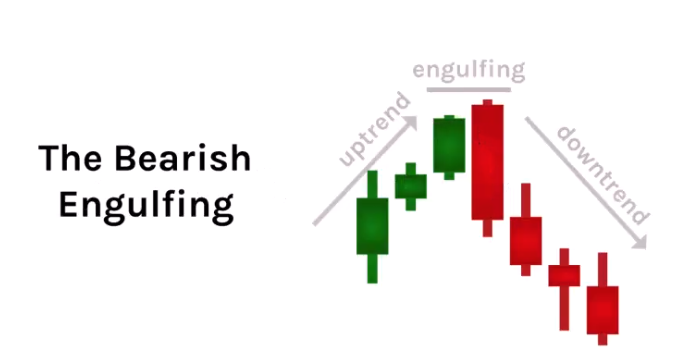
Bullish/Bearish Engulfing: Two candles where the second completely engulfs the first. Bullish engulfing at bottom of downtrend = reversal signal (buyers overwhelmed sellers). Bearish engulfing at top of uptrend = reversal signal. Look for high volume to confirm.
Inside Bar (Harami): Small candle completely inside the previous candle's range. Shows the trend is pausing — indecision. The next candle determines direction.
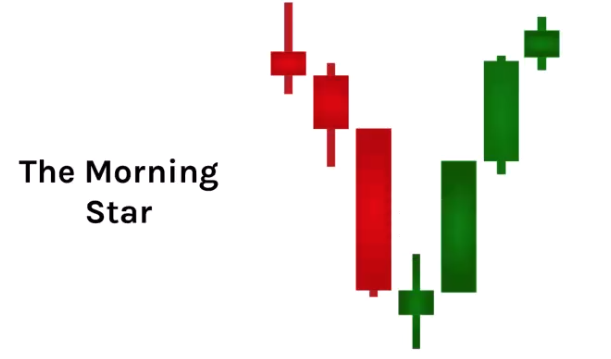
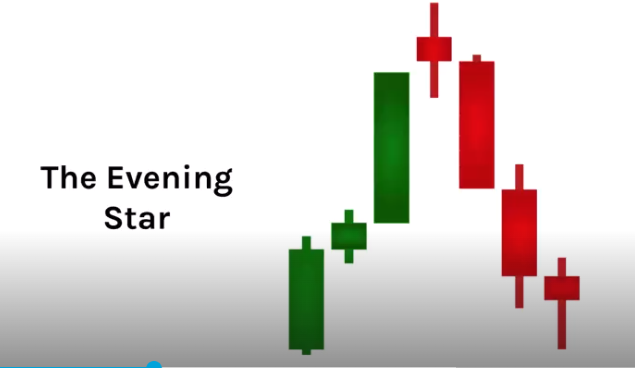
Morning Star / Evening Star: Three-candle reversal pattern. Morning star (bullish) = long red → doji/small body → long green. Evening star (bearish) = long green → doji/small body → long red. The doji shows the battle, the third candle shows who won.
Volume with Candlestick Patterns
- Reversal patterns (engulfing, hammers, stars) should have HIGH volume to confirm
- Climax/exhaustion candles at the end of trends often show extreme high volume
- Trend confirmation candles (marubozu) should be accompanied by strong volume in
pricethechartstrendthatdirection
Chart Patterns
ASX Trader's honest take: "If I had to drop one lesson from the entire course, it would be this one." He's not a recognisablechart shapes,pattern manytrader — patterns can go either way and markets sometimes do the opposite because everyone is watching the same pattern. However, patterns complement other tools and provide useful common language.
The key principle: Don't just trade because you see a pattern. Unpack what's under the hood — it's all market structure. If you can identify pivot points and market structure, you don't technically need to know pattern names. But knowing the language helps communicate with other traders.
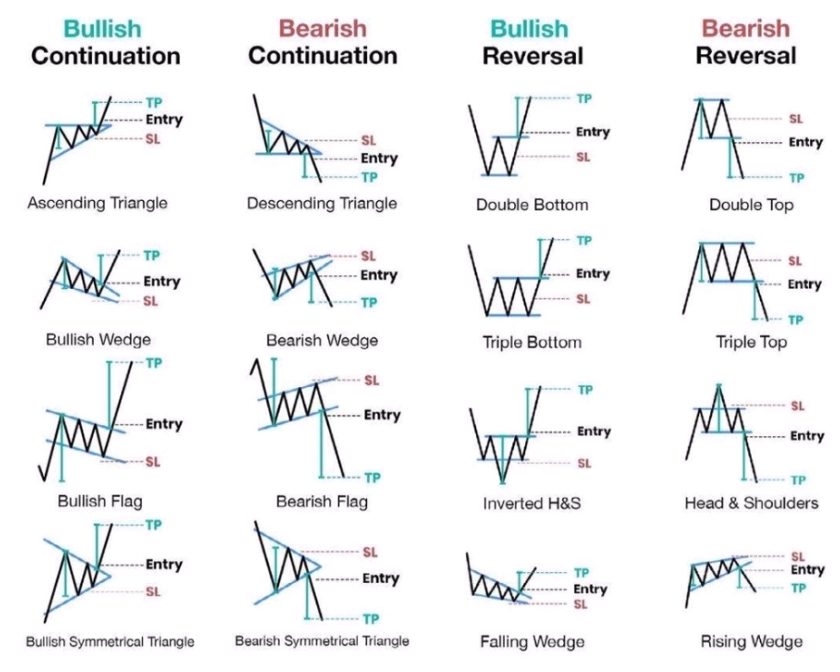
Continuation Patterns
Triangles
Converging price ranges showing a pause in the trend. Three types:
Symmetrical: Both lines converging at equal slopes. No directional bias — neutral consolidation. Direction depends on the breakout.
Ascending: Horizontal resistance + rising support (buyers stepping in higher each time). ~80% probability of upside breakout. Eventually sellers get exhausted.
Descending: Horizontal support + falling resistance (sellers stepping in lower each time). Eventually buyers get exhausted and it breaks down.
Elliott Wave connection: Triangles occur before the FINAL wave (wave 5 / excess phase). After a triangle breakout, expect one last push, then a correction. This is why triangle breakouts can trap retail traders see— themthe move after the triangle might be short before rolling over.
Breakout vs fake-out: If a triangle breaks out and comes back within the pivot, it was likely a fake-out or a short excess phase. Check volume — breakout should be on high volume. Also check for divergence from the start to end of the triangle.
Flags & Pennants
Flags are short consolidation periods against the trend direction after a sharp impulse move (the "pole"). They're strong continuation patterns.
Bull Flag: Uptrend → sharp move up (pole, high volume) → consolidation down (flag, low volume) → breakout continuation (high volume). The flag should NOT retrace past the Fib 382 (maybe 500 max). If it goes to 618, it's too deep — it's not a flag, it's a weak trend.
Bear Flag: Downtrend → sharp move down → consolidation up to the zag zone (302-618) on low volume → breakdown on high volume.
Pennants: Same as reliableflags indicatorsbut the consolidation forms a small symmetrical triangle instead of a channel. Also shouldn't retrace past 382.
Cup & Handle
Continuation pattern: prior uptrend → rounded bottom (the cup) → small pullback (the handle, which is basically a bull flag) → breakout. Handle should retrace to Fib 382, max 500. Handle must form on lowering volume. Breakout on increasing volume. Measured target = depth of the cup projected upward from the breakout.
Darvas Box (Rectangle)
Sideways consolidation with equal highs and equal lows. When it breaks out, check: is volume confirming? If breakout comes back within → liquidity grab (check OBV — was it going up on lowering volume?). If it breaks out and continues with strong volume → genuine breakout.
Reversal Patterns
Head & Shoulders / Inverse H&S
A head & shoulders is just a failure swing. Shoulder, head, shoulder = higher high, higher low, higher high, then lower high (the right shoulder fails to reach the head), then breaks the neckline.
Advanced H&S with volume and divergence:
- Left shoulder forms on increasing volume
- Head forms on LOWERING volume (weakness) + bearish divergence from left shoulder to head on RSI
- Right shoulder forms on LOWERING volume (dumb money buying the dip)
- Neckline break should come on increasing volume (sell pressure confirms)
- Measured target = distance from neckline to head
The neckline doesn't have to be horizontal — it can be diagonal.
Fractals: Each wave can have its own mini head & shoulders. Multiple small H&S patterns combine to form one large H&S (accumulation → public → excess → correction).
Wedges (ASX Trader's Favourite)
Converging trend lines both moving in the same direction (unlike triangles where they move in different directions).
Falling Wedge (Bullish): Both lines sloping down but converging. Tension builds as the trend tightens. Breakout to the upside on increasing volume. ASX Trader's favourite pattern — gives phenomenal risk:reward because you can enter on the breakout and place a tight stop loss. Target = back to the top of where the wedge started. Look for bullish divergence on both OBV and RSI as it comes todown crowdthe psychology.wedge.
Multi-Timeframe Candlestick Analysis
- Identify primary trend on higher timeframes (daily, weekly, monthly)
- Confirm on lower timeframes — look for consistent patterns aligning with the primary trend
- Spot entry/exit points on even lower timeframes (15min, 5min) for precise entries
- Detect confluences — a bullish reversal pattern on the daily, supported by a similar pattern on the 4-hour, with increased volume = strong setup
Example: A bullish engulfing on the daily = look inside and you might see a double bottom on the hourly. Two reversal signals confirming each other across timeframes.
Advanced Pattern Analysis — Combining Everything
The real power of patterns comes from combining them with volume and divergence:
For reversal patterns (H&S, wedges):
- Look for divergence on BOTH RSI and OBV as the pattern forms
- The reversal candles should have high volume
- The continuation into the pattern should show lowering volume (weakness)
- When you get divergence on price momentum AND volume momentum, plus a change of market structure = high probability setup
For continuation patterns (flags, triangles, boxes):
- The consolidation should happen on lowering volume
- The breakout should happen on increasing volume
- OBV should confirm the breakout (if OBV doesn't break out with price, it's likely a fake-out)
- Triangles = one more push before a correction (excess phase), so trade with awareness it might be short