
Complex divergence
Recap: Regular Divergence Fundamentals
RSI is a price momentum indicator. Most people (90%) use it for overbought/oversold — but the biggest moves happen when RSI IS overbought/oversold. On larger timeframes (monthly/weekly), overbought/oversold readings can be meaningful. On daily and below, they're less reliable.
Key rule: Divergence must start from an overbought or oversold reading first. You don't get valid divergence in the neutral zone (30-70). The first extreme (overbought/oversold) establishes the baseline, then the next move creates the divergence.
Divergence strength recap:
- Strong: New low in price, higher low in RSI (or new high / lower high)
- Medium: Double bottom in price, higher low in RSI (or double top / lower high)
- Weak: New low in price, double bottom in RSI (or new high / double top)
Divergence means weakening, not necessarily reversal. It could lead to a sharp correction OR a sideways consolidation. Always trade the trigger (change of market structure), not the signal (divergence alone).
What Is Complex Divergence?
Complex divergence is when you get regularmultiple divergence turningsignals intothat hiddencombine together before a reversal occurs. Instead of one clean divergence → reversal, the market gives you several divergence signals in sequence.
You might get: strong → medium → weak before the actual reversal. Or three strongs. Or strong → weak. Any combination. The market is like your body during a long run — sometimes you get tired after the first signal and stop. Sometimes you push through several signals of fatigue before finally stopping.
This is exactly why you trade the trigger, not the signal. If you traded the first divergence signal every time, you'd get wrecked when the market produces two or three more before actually reversing. Each divergence signal says "weakening," but only the change of market structure says "reversed."
Practical Example
On the S&P 500 daily: price made higher high after higher high after higher high, while RSI recapmade lower high, lower high, lower high. Three bearish divergence signals in a row. If you'd shorted on the first one — stopped out. Second one — stopped out again. It wasn't until the actual change of market structure (break below support) that the reversal confirmed. All the divergences were correct that the trend was weakening — the trigger was what told you WHEN.
Multiple Timeframe Divergence
Multiple timeframe divergence is where you look for divergence signals across different timeframes simultaneously. This is how you pinpoint major reversals and get precise entries on big moves.
The Fractal Principle
Each phase contains sub-phases. Each sub-phase contains its own divergence:
RSIMonthly:isDivergenceafrommomentumtopindicatorof public participation to top of excess phaseOverboughtWeekly:>Within70that monthly excess, there's its own accumulation → public → excess, with divergence from its public to its excessOversoldDaily:<Within30that weekly excess, same thing again- 4-hour / 1-hour: Within the daily, same fractal pattern repeats
If you get divergence on the monthly AND the weekly AND the daily AND the hourly — you're looking at a major reversal, not just a small pullback.
RegularHow divergence
to - Use It
OnlyStartstartsonaftertheindicatormonthlyhits—anisextremethere bearish divergence? If yes, the big trend is weakeningWarnsGo to thecurrentweekly — is there also bearish divergence? If yes, the intermediate trend is weakening(price makes HH but indicator makes HL)tooMultipleGohits ofto thesamedaily — bearish divergenceincreaseshere too? The shorter-term trend is also weakening- Go to the
probability4-hourofor hourly — look for the actual reversal pattern and pinpoint your entry
Top-down approach (eagle → hawk):
You're looking at the big picture like an eagle, then zooming down like a biggerhawk moveto
Multi-timeframeexact divergence
entry. - Your
Ifentrydivergencemightis foundbe on the1Dhourly,&but1HR,you'reit suggeststrading astrongermonthlypotentialreversal.toWhy
reverseThiscomapredMatterstofor Trade SizeIf you have divergence only on
onethetimeframehourly, EG:expectBTConlyinan2021,hourly-level pullback. If you have divergence on theweekly,monthlydaily,+ weekly + daily + hourly, you're looking at a major multi-month reversal. The timeframe of the divergence tells you the magnitude of the expected move.Real example (Bitcoin top): Monthly showed bearish divergence from the public to excess. Weekly showed the same. Daily showed the same. 4-hour showed a double top with bearish divergence. Hourly confirmed the reversal pattern. Entry was on the hourly, but the trade captured the entire monthly-level correction.
Real example (Bitcoin bottom): Monthly showed bullish divergence. Weekly confirmed. Daily confirmed. 4-hour showed bullish divergence. Hourly showed double bottom with change of market structure. Entry on the hourly captured the start of the entire new bull market.
Divergence to Convergence — When Has It Played Out?
This is the key concept most traders miss: how do you know when the divergence has finished playing out?
The Answer: When Divergence Returns to Convergence
- Convergence = price and RSI are doing the same thing (both making HH/HL or both making LL/LH) → GREEN = healthy
- Divergence = price and RSI are doing opposite things → RED = weakening
toWhena divergencehasphase"playedreturnsout"Whenconvergence, theRSIsignalcomeshasbackplayedintooutconvergence -and the market isin"backsyncto normal."The Green-Red-Green Framework
Map your chart into zones:
- Green zone (convergence): Price going up, RSI going up — they match. Trend is strong
- Red zone (divergence): Price still going up, but RSI starts going down — they don't match. Trend is weakening
- Green zone again (convergence): After the correction, price going down AND RSI going down — they match again. The divergence has played out
The Target: Back to Where Divergence Started
Wherever the divergence started from is where price tends to correct back to. The trend was strong up until the point of divergence. Everything after that point was a "fake" or weakening trend. The correction wipes out the weak portion and returns to where the trend was last genuinely strong.
S&P 500 Examples
- 1986-1987: Convergence (green) throughout the uptrend. Then divergence (red) started. The correction wiped out the entire divergence period — about 1-2 years of gains — and came back to where the divergence began
- Pre-GFC: Long period of convergence (green), then divergence (red) began. The GFC correction came ALL the way back to where the divergence started — even though price had gone much higher during the divergence period. The whole "fake" portion was corrected
How to Apply This
Use the green/red framework as another point of confluency:
- Mark where divergence started (draw a vertical line or horizontal level)
- That level is a potential target for the correction
- Combine with Fibonacci zag zone — if the divergence start point aligns with the
indicator382-618 zone, that's powerful confluency
Steps to Find a Major Top
A practical step-by-step process:
- Monthly: Is there bearish divergence? (Higher price, lower RSI)
TheWeekly:peakConfirm — also bearish divergence?- Daily: Confirm — bearish divergence or double top with weakness?
- 4-Hour: Look for the excess phase of the excess phase — bearish divergence within the final push up
- Hourly: Pinpoint the actual reversal — look for change of market structure
Draw RSI divergence on candle BODIES, not wicks — RSI doesn't consider wicks.
Important Note: Tops Are Easier Than Bottoms
The educator finds it easier to identify tops of impulse moves than bottoms of corrections. Why? Impulse moves follow a predictable 5-wave pattern (accumulation → public → excess) with divergence from wave 3 to wave 5. Corrections can be complex — sharp, sideways, extended, shallow, deep — making the exact bottom harder to pinpoint. Corrections often end in the golden pocket (382-618), but WHERE within that zone is
atricky.good
markerRules & Guidelines for Complex Divergence
- Always start on the largest timeframe and work your way down
- Divergence must start from an overbought or oversold extreme — not from the neutral zone
- Draw lines on candle bodies, not wicks — RSI follows bodies
- Multiple divergence signals don't mean "short now" — they mean the trend is weakening. Wait for the trigger
- The point where
pricedivergencecanstartedcome=backyour correction target — the trend was genuine up to that point - Green (
seeconvergence)PLS→below)Red (divergence) → Green (convergence) = the cycle is complete - Divergence across multiple timeframes = bigger expected move — hourly divergence = hourly pullback. Monthly divergence = monthly-level correction
- Price action is still king — divergence is the blinker, not the turn
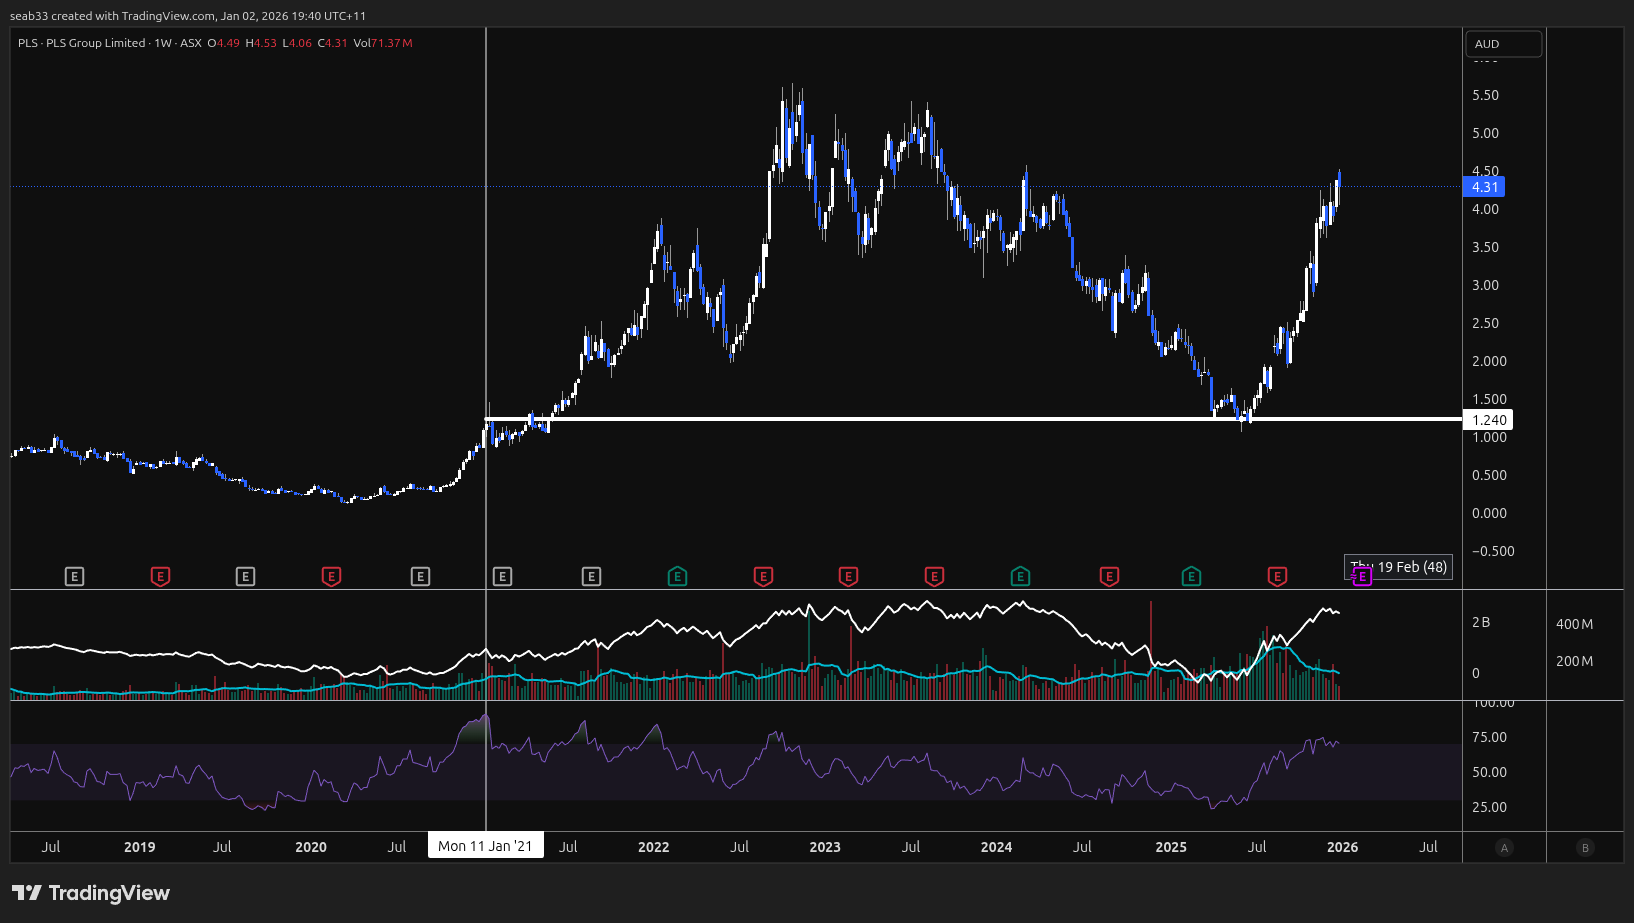
RSI resetWhen rsi resets - it means the RSI has gone from one extreme to the otherDON'T pay attentionto the RSI data to the left of the reset
