
2.9 - Fibonacci extensions
Fibonacci Extensions
Purpose: To set price targets & support / support/resistance levels
While fibFib retracements are used to measure where price might retrace to, extensions areproject where price might extend toto.
Fib extension levels are expressed on ratios as percentages, being:ratios:
11.0<-← Important- 1.272
- 1.618
<-← Important (strongest magnet) 22.0- 2.618
<-← Important - 3.618
- 4.236
- 4.618
Just because the price hits an extension level,level doesn't mean you automaticllyautomatically sell, but it can be a stronger sell signal if you see weakness approaching or hitting the zone.
If it's a weak move (corrective wave), the C wave,wave usually only hits 11.0 or 1.618
In a parapolicparabolic trend, goingswitching to log scale is highly recommendedrecommended.
How to Draw Extensions
ToThree drawclicks: aSwing retracement,low you→ goswing fromhigh → next swing low to(for swingprojecting highupside). toYou're the next swing low.
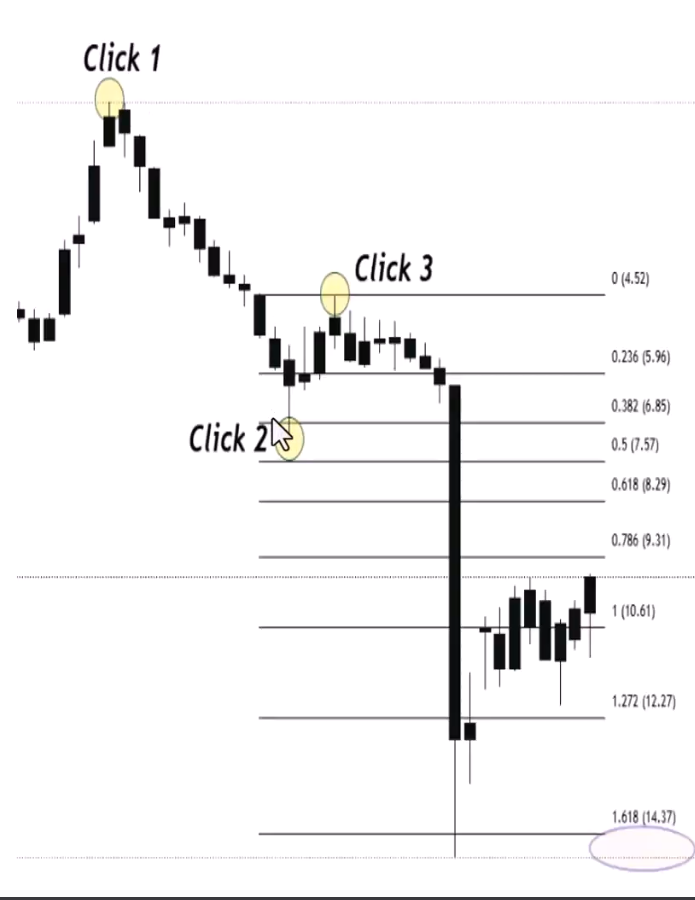
The 1.618 is usually the strongest magnet.
For the 3 clicks, you need to selectselecting from the start to the end of the correction,correction — not really meant to gojust swing high to low to high.
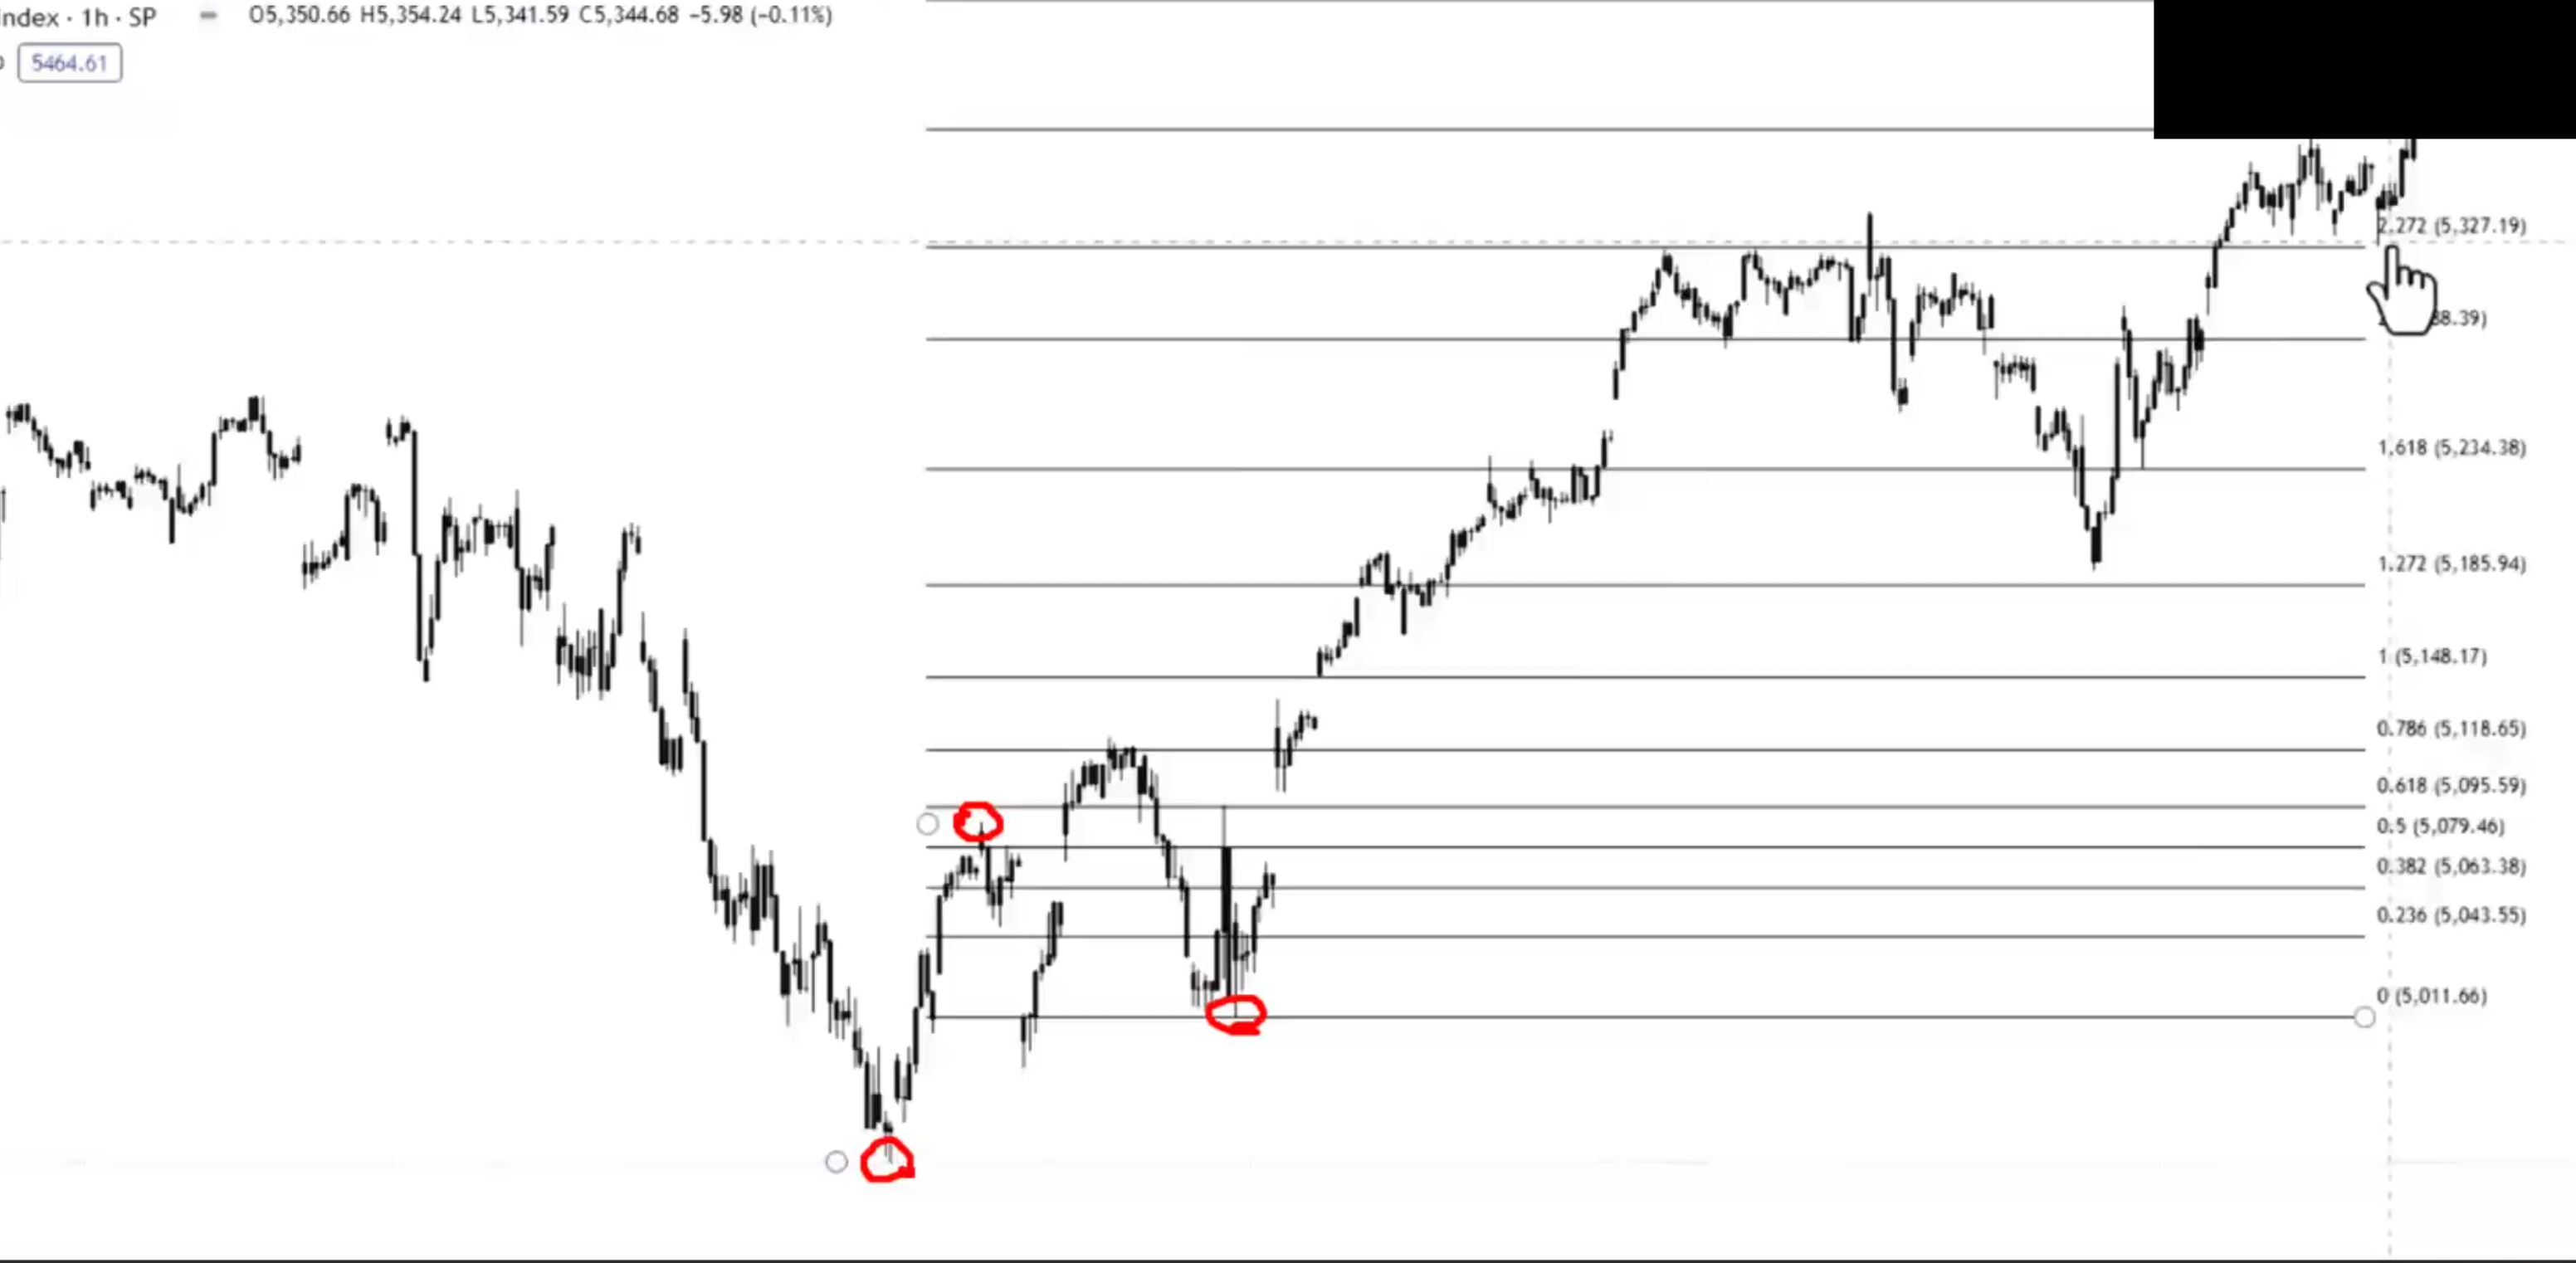
How Markets Move — Retracements + Extensions Together
The full cycle of using Fibonacci in a trending market:
Wave 1 (Accumulation breakout): First push up. Once it finalises, expect a deep retracement — typically down to the 618 or even 786 zone. Why deep? Nobody knows it's wave 1 yet — sentiment is still bearish, they think it's just a continuation of the downtrend.
Wave 2 (Deep zag): Comes down to the 618 zone. Once it bounces and takes out the wave 1 high, you can draw your trend-based Fib extension (bottom → top → pullback low) to project the next target. The 1.618 is the most common target for the next leg.
Wave 3 (Public participation): Extends up to the 1.618 target zone. Then you get another retracement — but this time it's typically shallower (382 or Fib 500) because the trend is now established and stronger. If wave 2 was deep, wave 4 is usually shallow (and vice versa).
Wave 4 (Shallow zag): Comes down to the 382 zone. Once it bounces and takes out the wave 3 high, draw another extension to project wave 5's target.
Wave 5 (Excess): Extends to the target, then you get the big correction of the whole move.
The Critical "Past the Zag Zone" Signal
If price comes down to the zag zone (382-618) and bounces = healthy, all good. But if it then rolls over, changes market structure, and breaks through the resistance-turned-support:
- You're NOT just retracing the last move — you're retracing ALL of it
- Get out the Fib retracement from the ENTIRE move (bottom of wave 1 to top of wave 5)
- Look for support in the 382-618 of the whole move
- Once buyers step in there + change of market structure + break back above the decline = re-entry
"The minute we go past the zag zone and resistance didn't become support, I know I'm not just retracing from here — I'm retracing all of it."
The Repeating Process
- Retracement to find buy zones (where will the zag end?)
- Extension to find targets (where will the next zig reach?)
- Check Fib strength (236 = very strong, 382 = strong, 500 = normal, 618 = weak)
- Repeat at each new zig-zag
- When the zag goes too deep (past the zag zone) → switch to retracing the whole move instead of just the last leg
70-80% of the time, buyers step in at the zag zone. The probabilities are in your favour. When they don't, the probabilities shift — and that's when you don't want to be trading it. Always trade probabilities — stack the chips, become the casino.