
Fibonacci extensions
Purpose: To set price targets & support/resistance levels. While Fib retracements measure where price might retrace to, extensions project where price might extend to.
Fib extension levels expressed as ratios:
- 1.0 ← Important
- 1.272
- 1.618 ← Important (strongest magnet)
- 2.0
- 2.618 ← Important
- 3.618
- 4.236
- 4.618
Just because price hits an extension level doesn't mean you automatically sell, but it can be a stronger sell signal if you see weakness approaching or hitting the zone.
If it's a weak move (corrective wave), the C wave usually only hits 1.0 or 1.618. In a parabolic trend, switching to log scale is highly recommended.
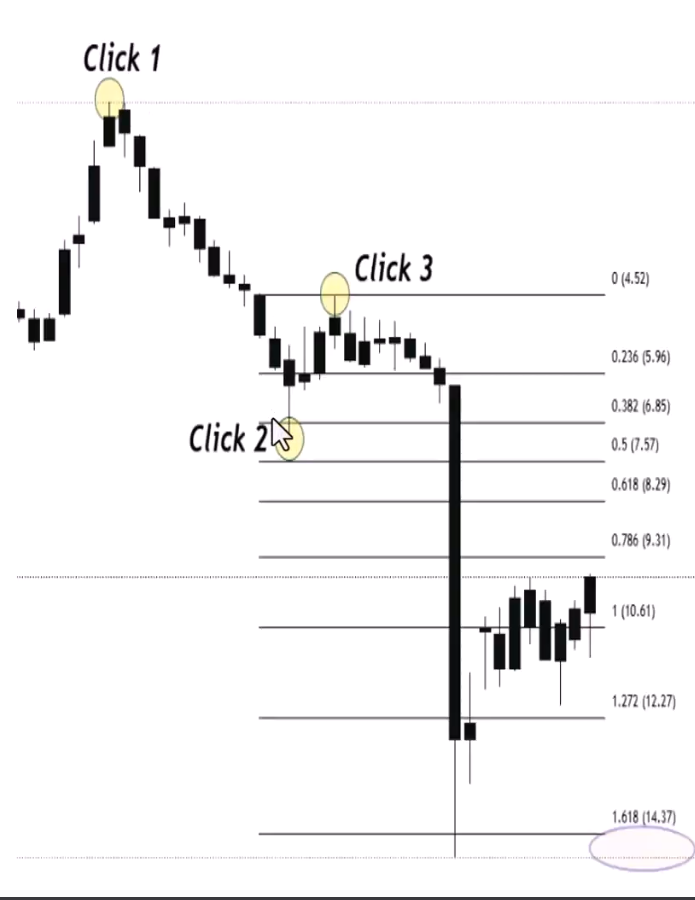
How to Draw Extensions
Three clicks: Swing low → swing high → next swing low (for projecting upside). You're selecting from the start to the end of the correction — not just swing high to low to high.
How Markets Move — Retracements + Extensions Together
The full cycle of using Fibonacci in a trending market:
Wave 1 (Accumulation breakout): First push up. Once it finalises, expect a deep retracement — typically down to the 618 or even 786 zone. Why deep? Nobody knows it's wave 1 yet — sentiment is still bearish, they think it's just a continuation of the downtrend.
Wave 2 (Deep zag): Comes down to the 618 zone. Once it bounces and takes out the wave 1 high, you can draw your trend-based Fib extension (bottom → top → pullback low) to project the next target. The 1.618 is the most common target for the next leg.
Wave 3 (Public participation): Extends up to the 1.618 target zone. Then you get another retracement — but this time it's typically shallower (382 or Fib 500) because the trend is now established and stronger. If wave 2 was deep, wave 4 is usually shallow (and vice versa).
Wave 4 (Shallow zag): Comes down to the 382 zone. Once it bounces and takes out the wave 3 high, draw another extension to project wave 5's target.
Wave 5 (Excess): Extends to the target, then you get the big correction of the whole move.
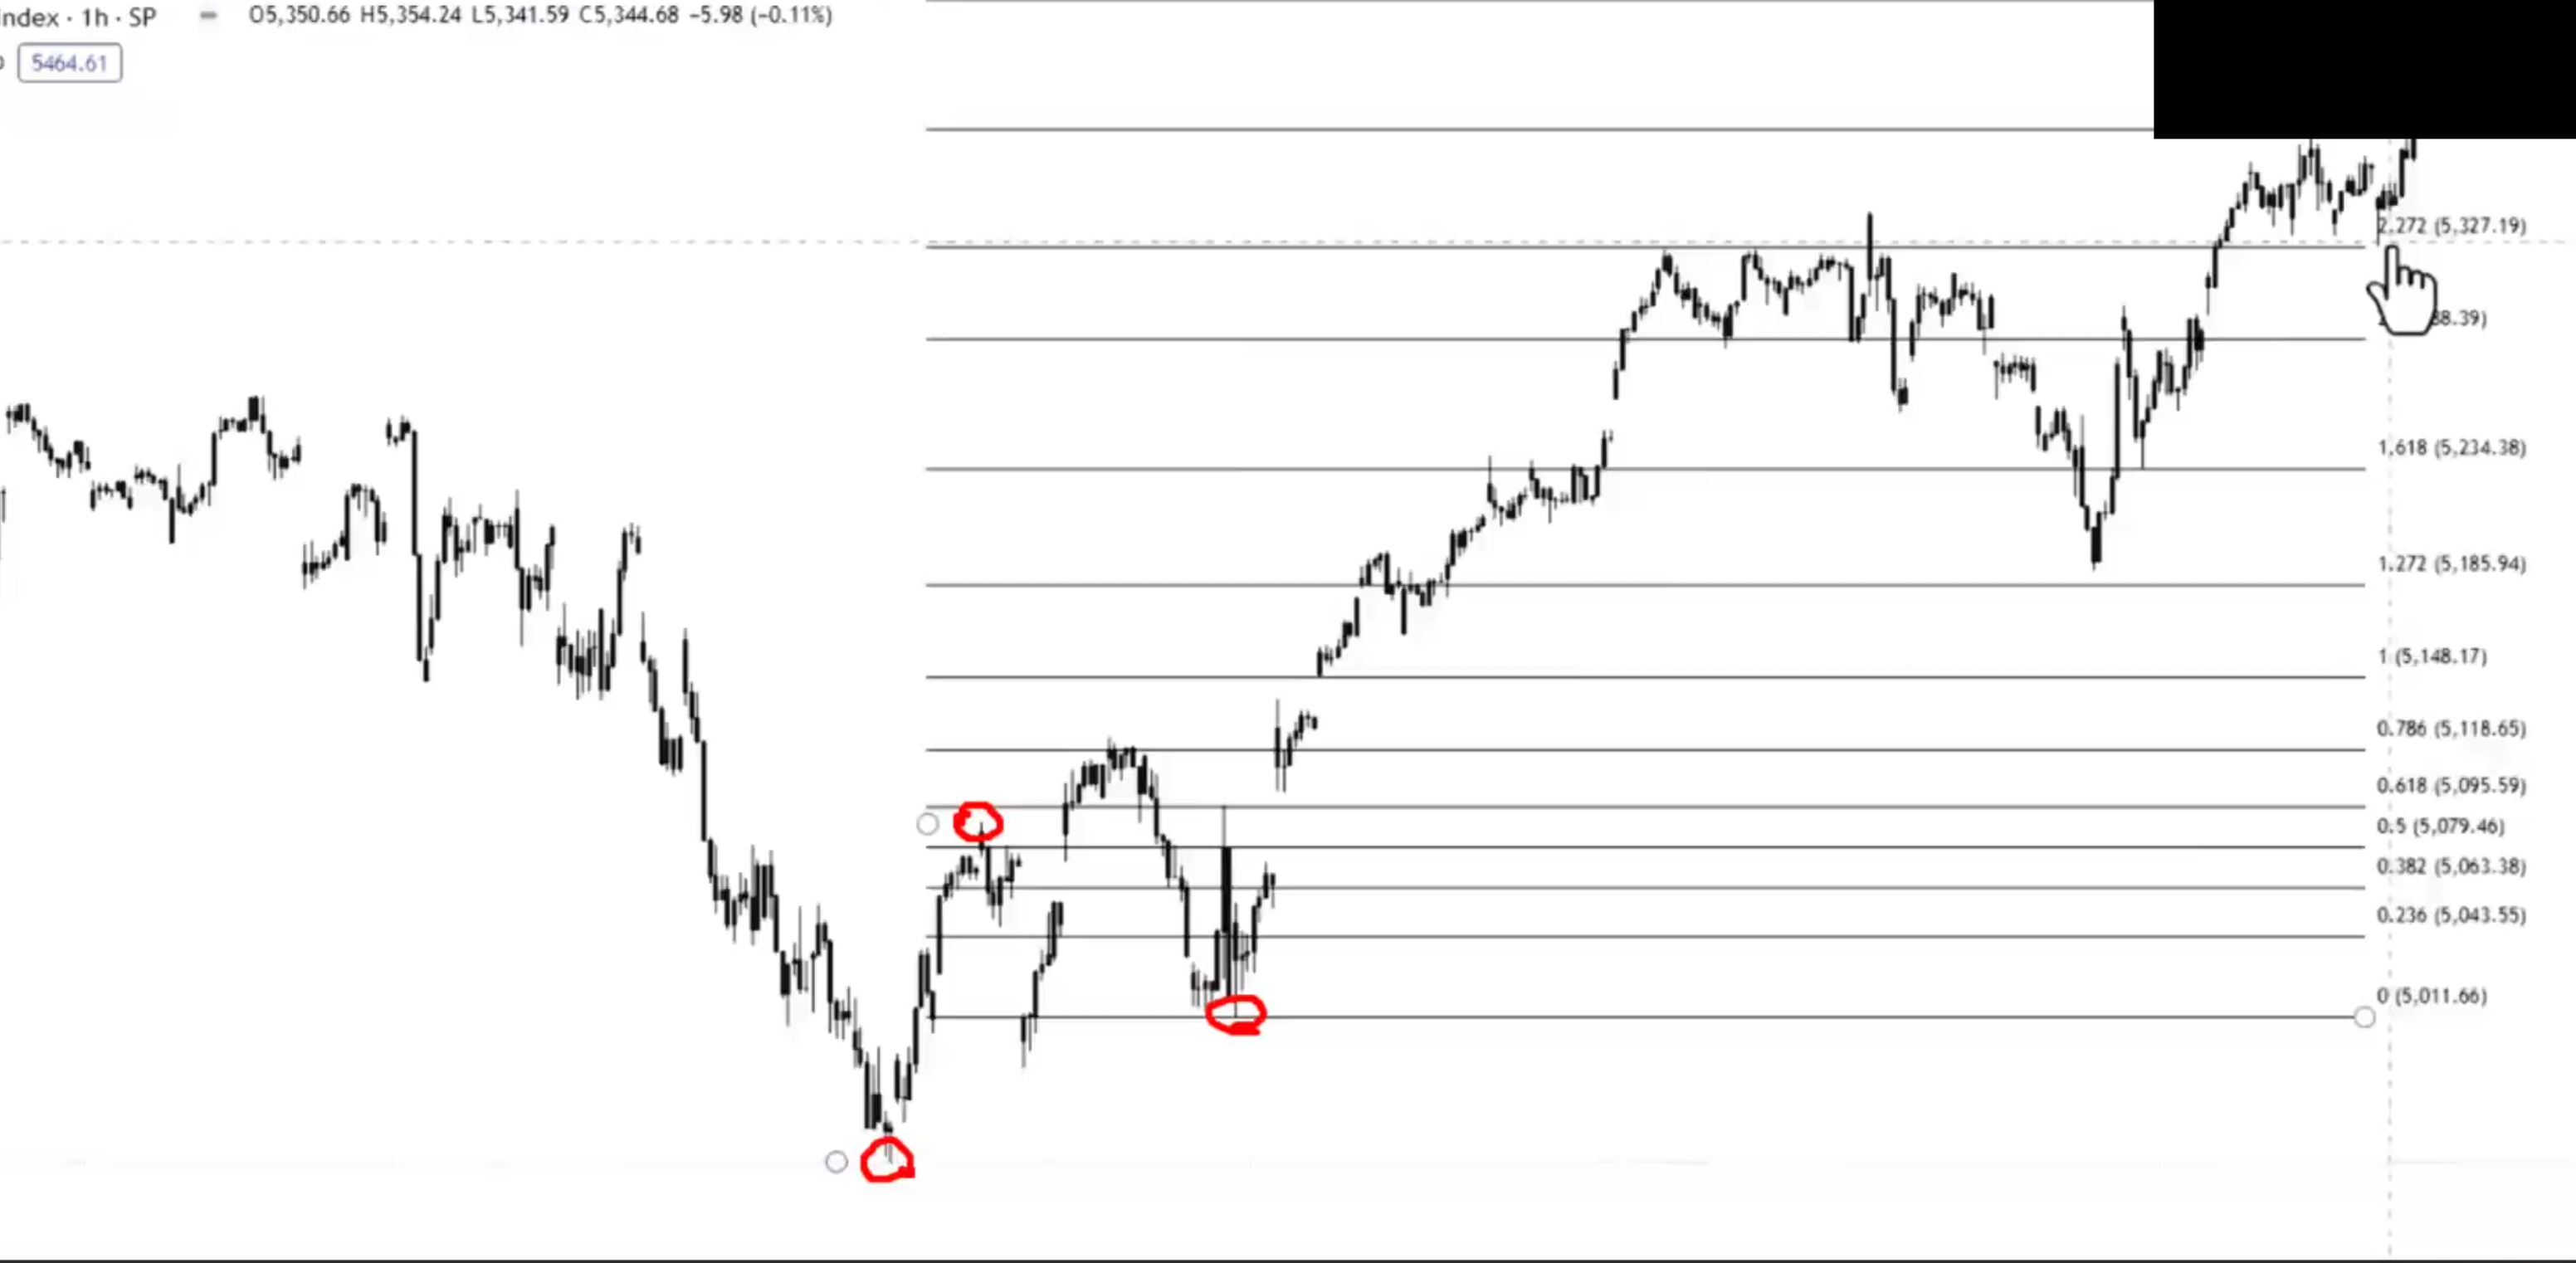
The Critical "Past the Zag Zone" Signal
If price comes down to the zag zone (382-618) and bounces = healthy, all good. But if it then rolls over, changes market structure, and breaks through the resistance-turned-support:
- You're NOT just retracing the last move — you're retracing ALL of it
- Get out the Fib retracement from the ENTIRE move (bottom of wave 1 to top of wave 5)
- Look for support in the 382-618 of the whole move
- Once buyers step in there + change of market structure + break back above the decline = re-entry
"The minute we go past the zag zone and resistance didn't become support, I know I'm not just retracing from here — I'm retracing all of it."
The Repeating Process
- Retracement to find buy zones (where will the zag end?)
- Extension to find targets (where will the next zig reach?)
- Check Fib strength (236 = very strong, 382 = strong, 500 = normal, 618 = weak)
- Repeat at each new zig-zag
- When the zag goes too deep (past the zag zone) → switch to retracing the whole move instead of just the last leg
70-80% of the time, buyers step in at the zag zone. The probabilities are in your favour. When they don't, the probabilities shift — and that's when you don't want to be trading it. Always trade probabilities — stack the chips, become the casino.