
Gaps
Gaps
Why Gaps occur because
Occur
Good /Good/bad earning announcements thataredifferdifferent tofrom market expectations- News /
Geopoliticalgeopolitical events - Overall market sentiment shifts
- Order imbalances
-— big buy/sell orders from institutional traders - Rumours
-— companypartering with another company,partnering, leakedinfoinfo, speculation
92% of gaps eventually get filled — so gaps are always good targets. If you know traders target them and they align with other areas of confluency (zag zone, S/R, Fibonacci), they're great profit-taking zones.
Types of gapsGaps
The natural sequence within a trend: Breakaway gap (start of trend) → Runaway gap (middle, public participation) → Exhaustion gap (end, excess phase reversal). Maps directly to accumulation breakout → public participation → excess.
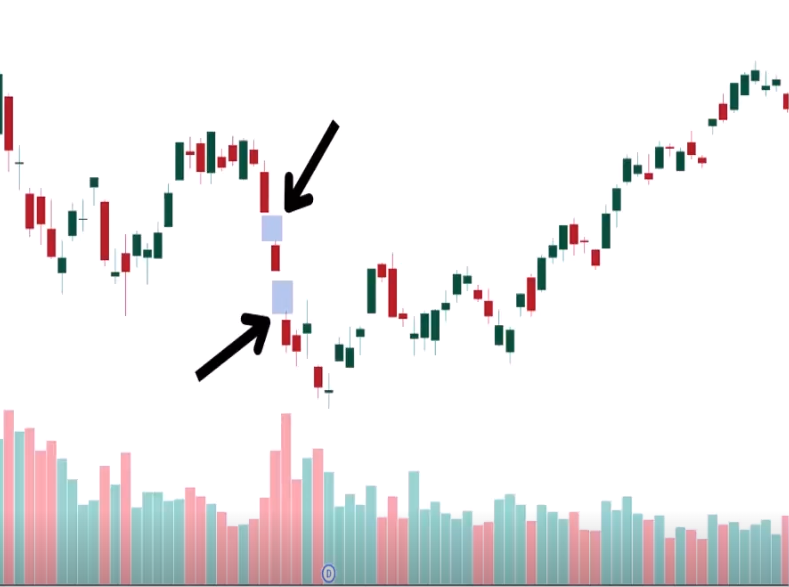
Common gaps
Gaps
- Appears in a weak or calm market
- No reason or
catlystcatalysttofor the gap — just minor supply/demand imbalances, market noise, routine technical adjustments - Often filled quickly — 100% of common gaps get filled
- Low volume — no significant surge in trading activity
- Useful for scalping — if something gaps up for no reason, there's a good chance it fills that day or within a few days. Look for nearby unfilled gaps as profit targets
- Real trade example: Sonic Healthcare gapped up for no reason → educator entered knowing the gap would fill → price came back and filled it same day, also filling a prior gap below. Then the next nearby unfilled gap above became the next target
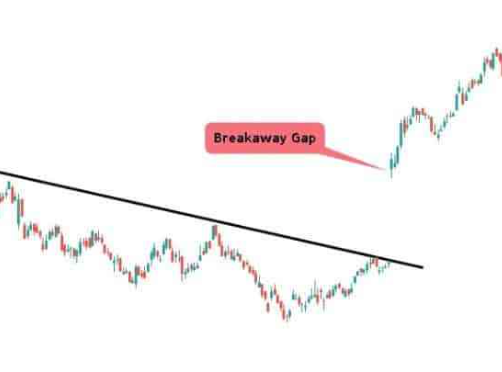
Breakaway gapsGaps
- Price suddenly breaks
athrough awellwell-defined structure (support or resistance)orinbreakstheoverform of asupport / resistancegap - Usually confirms a breakout
Usually—comessignalsfromthenewsstartorofbigaeventsnew trend- Happen at the end of a consolidation pattern or range
&and usually mark a new trend beginning - Larger than common gaps — reflects a strong shift in market sentiment
- Usually
followsfollowed with a significant increase in volume — confirms breakout strength - Do
notNOT fill quickly — represents a decisive market move, price generally continues in the gap direction - Stop loss: Below the gap for upward breaks, above the gap for downward breaks. The gap itself acts as S/R
- Usually
causecaused by:EarningEarnings reports (Exceedexceed orfailsfail to meet expectations)RegulatoryNewschangesannouncements (mergers, acquisitions, regulatory changes)- Market sentiment shifts
Geo-politicalTechnicaleventsbreakouts (breaking key S/R where stop losses are clustered)
- A2 Milk example: Had THREE breakaway gaps in succession — each one gapped below a major support level on high volume. Earnings downgrade after earnings downgrade, each time breaking the next support. The high volume on each confirmed institutional money exiting
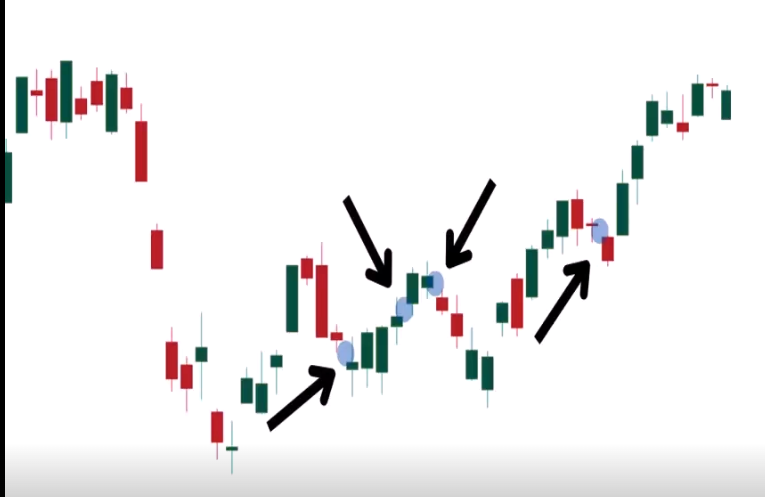
Runaway gapsGaps (continuationContinuation / measuringMeasuring gaps)Gaps)
- Appears when the market is gaining or falling
quciklyquickly — in the middle of an established trend - Signals dominant buyers or sellers
dominant— Highhigh probability of continuation- Usually
notNOT filled (until the trend eventually ends and the major correction begins) - Followed with moderate to high volume — confirms trend strength
- Usually in the public participation phase — where the public starts getting involved and everyone piles on
- Measuring tool: The distance from the trend start to the runaway gap can be projected forward to estimate the potential remaining length of the trend (similar to a bull flag measured move)
- If you see a runaway gap, don't take profit at the next resistance — the trend still has momentum and should continue. It's telling you NOT to exit yet
- How to distinguish from exhaustion: Runaway gaps happen in the MIDDLE of the trend. If you're getting gaps at the PEAK after a long overextended run = exhaustion, not runaway
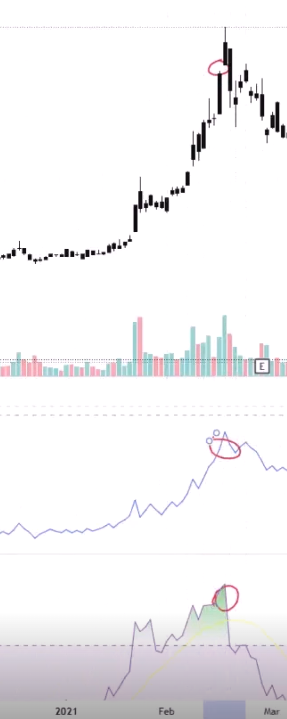
Exhaustion Gaps
If you gap and
thethen pivot within a few days,thenit'ts most likely an exhaustion gap
- Occur near the end of an existing trend, after
appear aftera prolonged pricemovmentmovement — the trend is reaching its climax - Usually
occompaniedaccompanied by a spike in volume-— the final rush of buying/selling (capitulation or complete greed) before the trendreversesreverses. This volume often includes retail traders, indicating the end of institutional interest - Exhaustion gaps are likely to be filled quickly as the market corrects and reverses
the previous trend - Signal a high
problabilityprobability of a trend reversal - Can be used to enter a trade in the opposite
sidedirection-— exhaustion gap at thebottom,bottom might be a good time to enter long EveythingEverything usually looks very overbought (RSI above 80) orgapsthe gap happens into bearish divergence- How to confirm it's exhaustion:
- RSI very overbought when the gap occurs
- OBV/volume showing institutional money NOT confirming the move (lowering OBV = retailers driving it, not big money)
- Pivot within a few days (doji → bearish engulfing after the gap = classic exhaustion confirmation)
- Already at the excess phase of the trend
- Zip example: Breakaway gap (start) → Runaway gap (middle) → Exhaustion gap (end). RSI very overbought when the exhaustion gap occurred, followed immediately by a doji and bearish engulfing = confirmed exhaustion. Same pattern on NVX and LKE
Professional Gaps (Institutional Gaps)
- Caused by actions of institutions, usually from:
- Earnings reports
RebalacingPortfolio rebalancing based on macro trendsInsiderInsider/privilegedinfoinformation or proprietary analysis
- Show sentiment and strategic decisions of institutional
playsplayers - Can remain unfilled for a long time if they reflect
longlong-term institutionalpositioning.positioning — especially mining discoveries - Usually after major announcements
-—eg,e.g.pointbet announcing they arePointsBet expanding toamerica.America, mining companies announcing discoveries - These signal the very beginning of a new trend — institutional money flowing in
- In Australia, most common with miners making discoveries — institutions unpack the report, like what they see, and start buying. Sometimes takes days as they read more and keep buying
- PDN example: Went from $0.006 to $0.019 in one gap (tripled), then 10x within two days as institutions kept reading the report and buying. Eventually went to $0.30+ — nearly 100x. That gap never filled because it was a genuine major discovery
- 3DP example: Institutional money came in at $0.05, gapped up to $0.08, eventually went to ~$1
Fair Value Gaps (FVGs)
- A place where price has moved too quickly
-creating a void — most popular in crypto due to 24/7 trading24/7(no normal gaps from market close/open) - Not an actual gap on the chart — it's the difference between the top of one candle and the bottom of the candle two periods later, with a big candle in between. The "hidden gap" in the body of that middle candle
- Very popular in SMC (Smart Money Concepts) — all about imbalances and liquidity
- Usually filled quickly due to
anmarketimbalanceseekingofto correct themarketimbalance VolumeVolume:- Lowlow volume gaps maybe filledfill quickerthen athan high volumegapgaps- Confluency power: If an FVG aligns with a golden pocket zone (382-618 Fibonacci), that's two independent reasons to expect a retracement to that area. Use FVGs as profit-taking targets when they align with your zag zone
- Crypto & Forex
- mostmost-filledtimeframes are:timeframes:- 1
hrhour - 15
mmin - 5
mmin - 3
mmin
- 1
Using Gaps for Confluency
Gaps are another tool for your confluency checklist — another river meeting the zone:
- As targets: If there's an unfilled gap that aligns with your Fibonacci zag zone (382-618) and/or a horizontal S/R level = high-probability take-profit zone. "Profit taking is your zag zone. If you can combine that zag zone with an FVG or a gap, it's giving you more confluency to take your profit there"
- As entries: If a gap fill brings price down to a zone where you also have support, Fib level, and bullish divergence = entry confluency
- For trend identification: Breakaway gaps confirm breakouts. Runaway gaps confirm trend strength (don't exit yet). Exhaustion gaps warn of reversal (start looking to exit)
- Scalping with common gaps: If something gaps for no reason, look for nearby unfilled gaps as quick profit targets — they tend to fill within hours or days