
MACD
General info
- Stands for Moving Average Convergence Divergence
- The MACD is a momentum indicator that shows the relationship between two moving averages
- The MACD line is calculated by subtracting the 26-period exponential moving average (EMA) from the 12-period EMA.
- The signal line is a nine-period EMA of the MACD line.
Commonly used to identify the changes in the strength, direction, momentum and direction of a trend
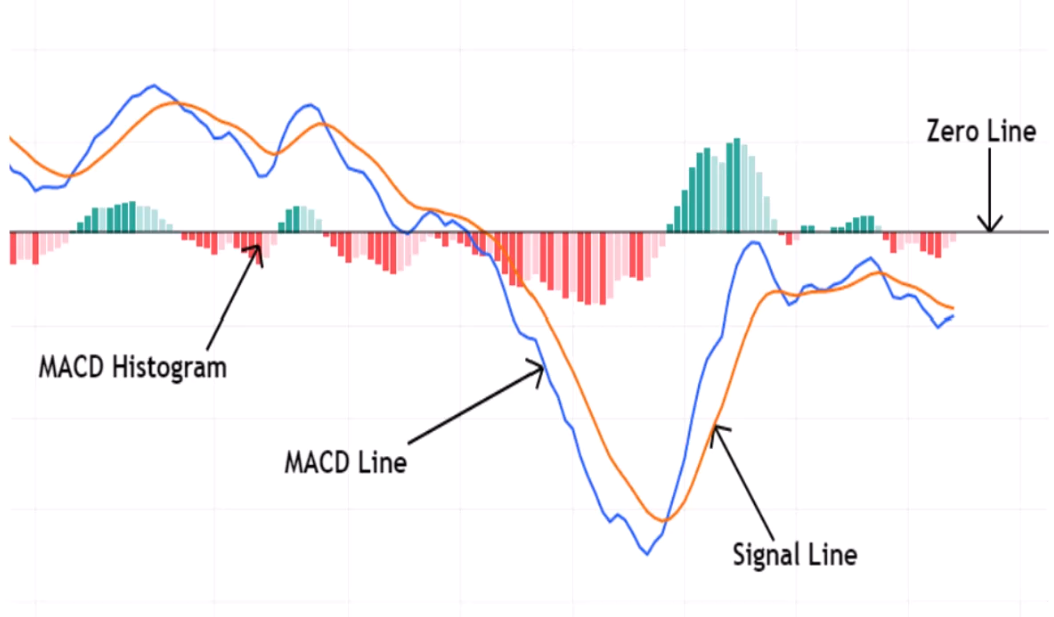
The MACD is made of 3 elements
- MACD line (blue - 12d minue 26d EMA)
- Signal line (orange - 9d EMA)
- Histogram - differences between the MACD & Signal line
Signals
- Bullish when MACD (blue) crosses above signal (orange)
- Bearish when MACD (blue) crosses below signal (orange)
- zero line cross - above bullish, below bearish
Histogram interpretation
- Growing bars - momentum increasing
- Shrinking bars - momentum decreasing