
Pattern recognition for confluency
Pattern Recognition for Confluency
Term 2 — combining divergence analysis with chart patterns for high-probability setups. The critical rule: hidden divergence is for continuation patterns, regular divergence is for reversal patterns.
The Core Rule: Match the Right Divergence to the Right Pattern
| Pattern Type | Divergence to Look For | Why |
|---|---|---|
| Continuation (triangles, flags, rectangles) | Hidden divergence | Continuation patterns show trend strength. Hidden divergence = continuation of trend |
| Reversal (H&S, double tops, wedges) | Regular divergence | Reversal patterns show trend weakness. Regular divergence = weakening trend |
You cannot use hidden divergence on reversal patterns — hidden is continuation of the trend, but the trend hasn't flipped yet at the reversal point. Similarly, you wouldn't look for regular divergence to confirm a flag breakout — that's a continuation setup.
Continuation Patterns + Hidden Divergence
Ascending triangleTriangle
Bullish reversal & continuation pattern
- —
Higherhigher lows each move into horizontal resistance.
- Volume confirming the downtrend (lower lows in volume matching lower lows in price)
- Hidden bearish on the rallies within the triangle (lower high on price, higher high on RSI)
- Hidden bearish → convergence on the breakdown
- Change of market structure through support
- Look for a
COMSchange of market structure WITHIN the box before the breakoutsomewhere—indon't just trade theboxbreakout alone - RSI can show hidden bullish at the start /
prepre-box as extra confirmation - Look for OBV to support the breakout — if OBV breaks out before price, that's a leading indicator
- If it breaks out and comes back in on low volume = liquidity grab, not genuine breakout
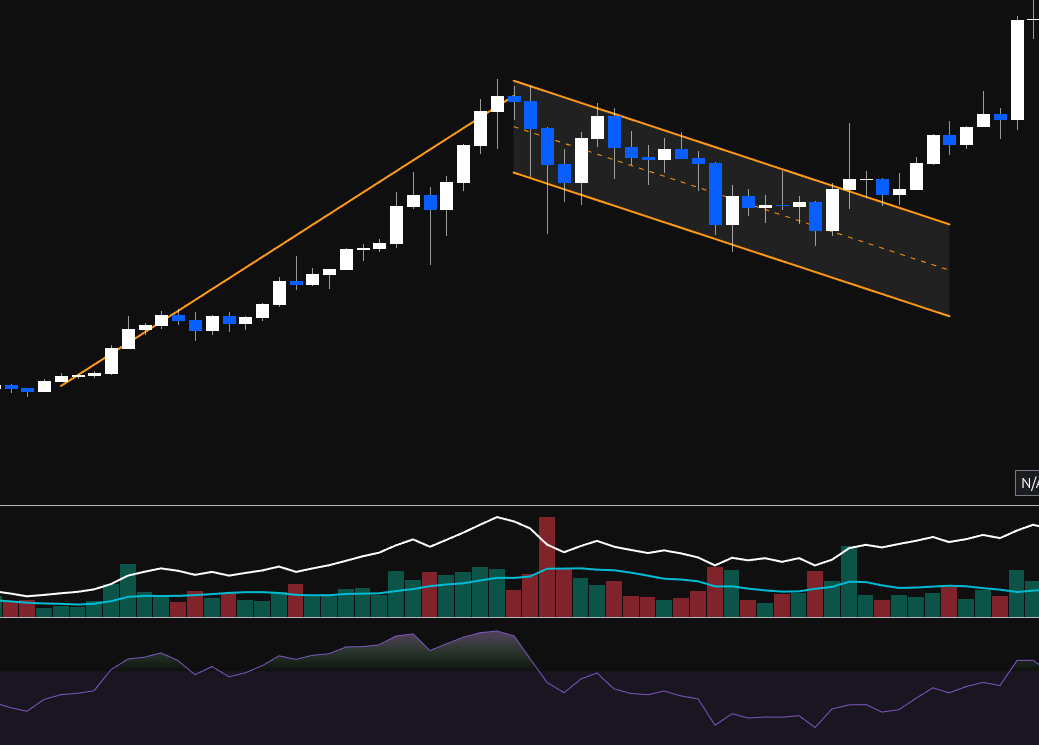
Strong impulsive move
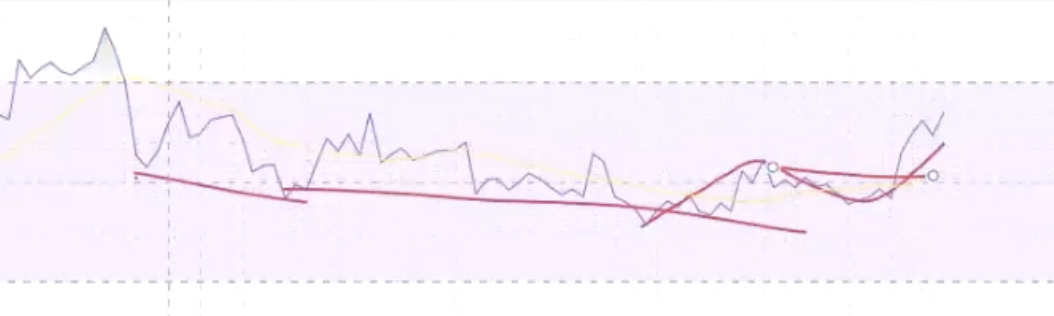
should formforms the pole, thena form of consolodation,consolidation usually in the form of a channel.- Measure
fibsFibs from the first downCOMSchange of market structure (reversal) to the topCOMSchange(revsal)of(market structure. An impulse move (zig)zag)zag - Check if volume did NOT support the move down and DID support the move up
- Compare larger pivot points for hidden bullish divergence
- Flag should NOT retrace past the Fib 382 (maybe 500 max). Definitely not 618 — that's not a flag
- When you find a
COMSchange of market structure at the end of the bull flag, look for:- A break through a decline
- Low down volume
- RSI continuation (hidden bullish → convergence)
- Bounce off the 0.382 area
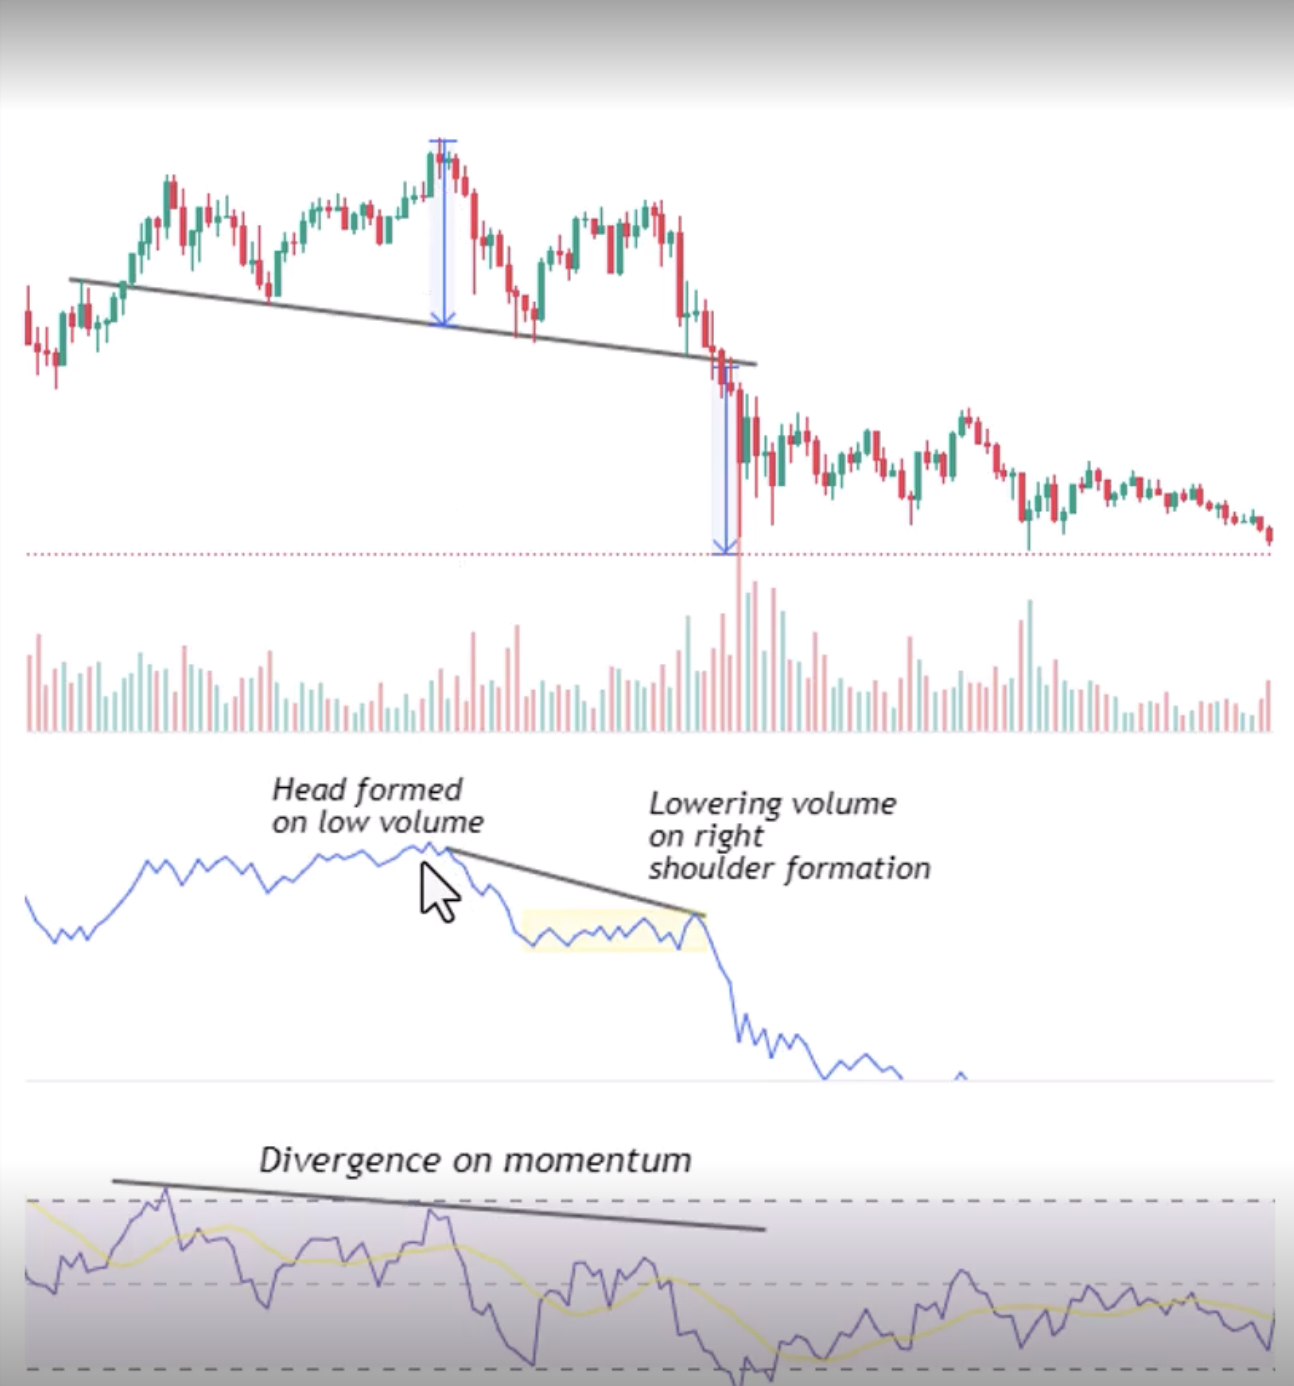
- The left shoulder is formed on
increaseincreasing positive volume - Divergence is found from the top of the left shoulder to the top of the head
- The head will form on
lowinglowering / flatOBV,OBV, signalling weakness in thetrend.trend - The right shoulder will be formed on even lower
OBV,OBV, showing weakness in the dip buyers (dumb money buying the dip — thank you very much) - When the
neck lineneckline is broken, the pattern is confirmed and there should be increasing down volume on thesellsell-off (even lower OBV) - The measured move is from the neckline to the top of the
head.head - When price makes an equal high (double top), RSI should be LOWER = bearish divergence (weakening trend)
- Volume: lowering volume on the second top. Volume confirms the zigs down but NOT the rallies back up (opposite of continuation)
- Divergence → convergence as it breaks the neckline
- No hidden divergence — this is a reversal pattern, only regular divergence applies
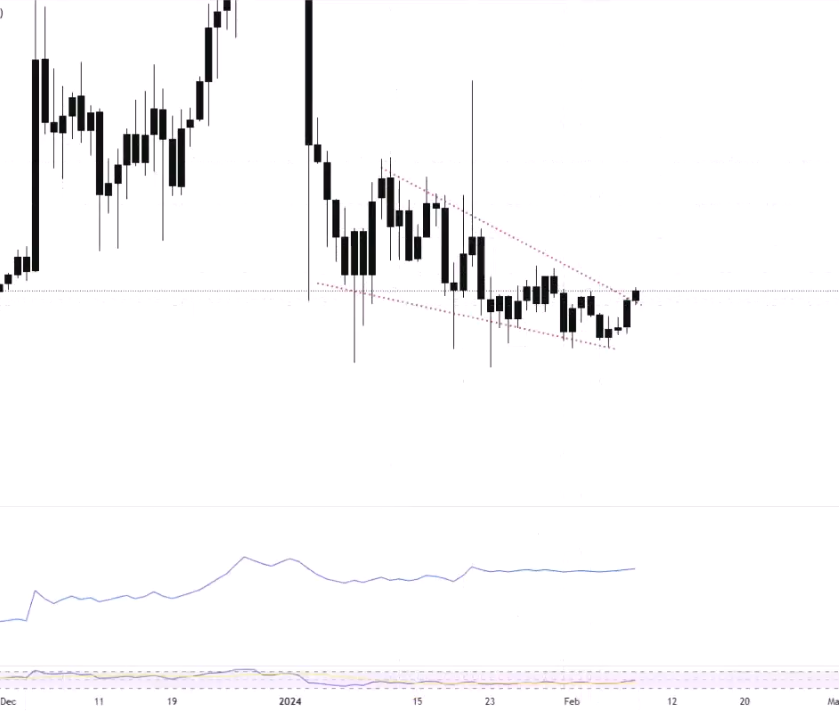
- If a wedge starts forming into a zag
zone,zone, that should be the end of the ABC - OBV should
notNOT support the move down andshouldSHOULD support the move up - Bullish divergence off the bottom of the wedge adds a point of
confluenceconfluency - Hidden bullish divergence off the low if running into a zag zone (showing the larger uptrend will continue)
- Hidden bearish could be found at the top of the wedge if not at a bottom (within the wedge, showing the downtrend within the wedge is continuing — but this transitions into bullish divergence as the wedge exhausts)
- Two types: retracement wedge (had an uptrend, corrected down into zag zone) and bottom wedge (at the very bottom of a long downtrend, the final move / ending diagonal)
- Volume: Confirm the trend direction, don't confirm the corrections
- Hidden divergence: From the pullback pivots showing continuation
- Divergence → convergence on the breakout
- Change of market structure through the pattern boundary
- Volume: Don't confirm the trend direction (weakening), DO confirm the reversal direction
- Regular divergence: Showing the trend is weakening
- Divergence → convergence on the change of market structure
- No hidden divergence — the trend hasn't flipped yet at the pattern formation point
- Market structure confirms it ✓
- Volume profile supports it ✓
- The right type of divergence backs it up ✓
- Divergence has moved into convergence ✓
- You have confluency from multiple independent methods ✓
Descending Triangles
Just the opposite — prior downtrend → hitting support → sellers stepping in lower each time.
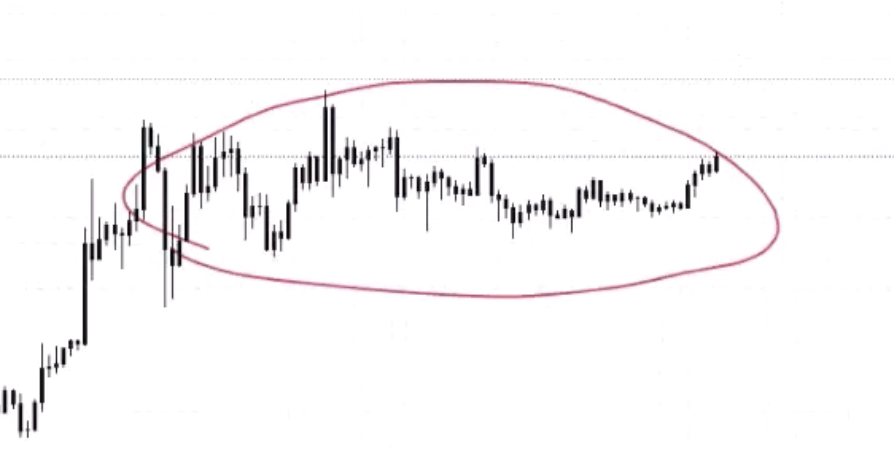
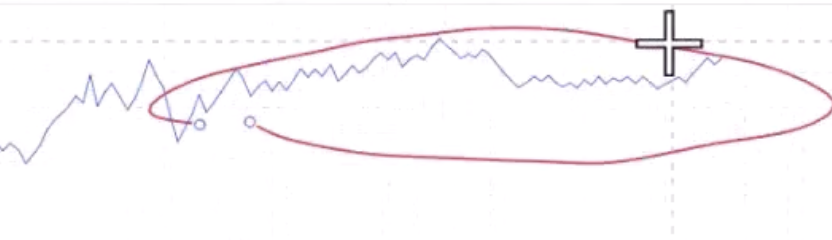
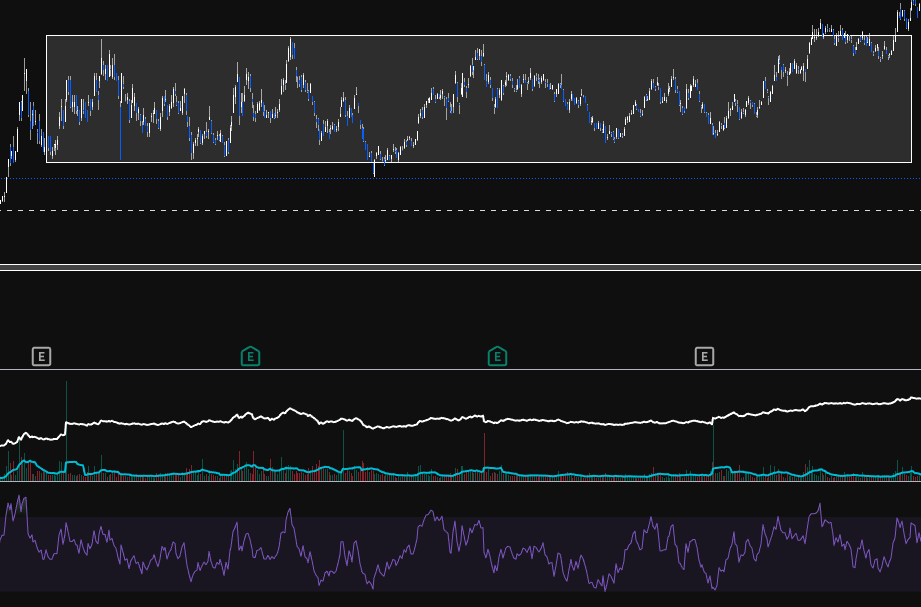
Darvas Box (Rectangle)
A neutral formation that can be bullish or bearishbearish.
Bull flagFlag
Reversal Patterns + Regular Divergence
Head & Shoulders
This is a bearish reversal pattern (failure swing).
Inverse H&S warning: An inverse H&S might just be a zag retracement, not a major bottom. Make sure it breaks through the zag zone. If buyers step in at the 382-618 but don't break through, it could just be a corrective bounce.
Fractals: Each wave can top with a mini H&S. Multiple small H&S combine into one large H&S across the full accumulation → public → excess cycle.
Double
Tops / BottomsFalling Wedge (ASX Trader's Favourite)
Summary: The Complete Pattern Fusion Framework
For Any Continuation Pattern
For Any Reversal Pattern
The Practical Takeaway
You're not trading because you see a pattern. You're trading because:
This is pattern fusion — combining the visual pattern with the underlying data (volume + divergence) to separate the genuine breakouts from the fake ones.