
Pivot points, market structure & the three phases of major trends
ThePivot points, market structure & the three phases of amajor trendtrends
Dow Theory — Foundation
Charles Dow is the grandfather of technical analysis. He co-founded the Dow Jones Industrial Average (1896, still running today) and the Wall Street Journal. His work was done without computers — all manually charted with pencil and paper.
The other three TA Titans built on Dow's work:
- Ralph Elliott — developed Elliott Wave Theory (wave structures driven by collective investor psychology). Dove deeper into the patterns within Dow's phases
- Richard Wyckoff — developed the Wyckoff Method, going deeper into exactly what accumulation and distribution phases look like (signature patterns)
- W.D. Gann — theories on price, time, and geometry. Everything runs on time cycles (life, weather, seasons — financial markets are no different)
The 6 Tenets of Dow Theory
Each tenet is covered in depth throughout the course. Summary:
AccumulationThe averages discount everything — all available information (economic, political, market) is already reflected in price. "Buy the rumour, sell the news" — if you're hearing about it, professionals already knewPublicTheparticipationmarket has three trends — Primary (long-term), Secondary (medium-term), Minor (short-term). A common mistake: wanting to invest long-term but taking entries on minor short-term movesExcessPrimary trends have three phases — Accumulation, Public Participation, Excess/Distribution (this week's focus)- A trend persists until its reversal is indicated — like Newton's first law: a trend stays in motion until acted upon. There are only three ways a trend can reverse (covered in Week 3)
- The averages must confirm one another — a trend needs confirmation from multiple sources, just like you'd research a major purchase from multiple angles, not just one data point
- Volume must confirm the trend — volume should rise with the trend. Big money can mask price action but they can't mask volume — you can't hide how many units were bought or sold
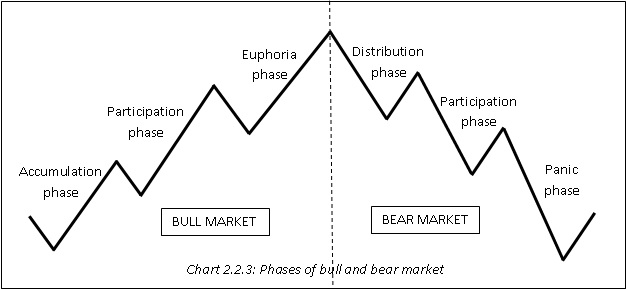
The Three Phases of a Primary Trend
A bull market is broken into three phases: Accumulation → Public Participation → Excess. Then it reverses through: Distribution → Public selling → Panic. Then it resets.
Phase 1: Accumulation
- Occurs after a prolonged decline or bear market
- Smart money
starts/ experienced investors start buyingUNDERVALUEDundervalued assets (just because something is down bad, doesn't mean it can't go down more) SentimentMarket sentiment isusuallyvery pessimistic — "this thing sucks", everyone expects it to keep going down- Low trading volumes and gradual price stabilisation
- Key insight: "If everyone's bearish, who's left to sell?" — that's often where it finds a bottom
- Can last years (Microsoft went sideways for 14 years after the tech bubble, FMG went sideways for 10 years after the GFC)
The Spring / Liquidity Grab: During accumulation, big money often pushes price below the bottom of the range before sending it up. Why? Anyone who bought support had stop losses just underneath — big money grabs that liquidity, shakes people out, then sends it. If something breaks out of a major sideways range to the downside and pops straight back in — that's actually a sign of strength (a "spring"). The opposite applies to distribution: a pop above the range that falls back in is a sign of weakness.
Phase 2: Public participationParticipation
- Momentum builds as more investors recognise the trend
- Media and public interest increases — some positive news articles, battle between bulls and bears
PricesPriceriserises significantly due to higher demand- This is usually the longest phase — where the most gains come from
- Increased trading volumes
- Positive
sentimentmarket sentiment, with a taste of euphoria toward the very end - The really savvy investors get in early in this phase, majority get in mid-to-late
Phase 3: Excess
Can be in the form of a blow off top or sideways distribution- Smart money begins selling at
highhigher prices
- Can manifest as a blow-off top (fast spike then fast sell-off) or a long sideways distribution
- Overvaluation concerns arise but people start ignoring them ("maybe the market just likes it at this price")
- Sentiment is overly optimistic or euphoric — you'll struggle to find anyone saying anything bad about it. 90% bullish
- Declining
tradetrading volumevolumes dispitedespite higher prices — price going up but volume not confirming (Tenet 6)
- Signs of reversal or instability may appear but average investors won't recognise them
The Sentiment Cycle
The emotional progression through the phases:
Bull market (going up): Disdain → Skepticism ("just a dead cat bounce") → Caution → Growing confidence → Conviction → Peak Greed/Euphoria
Bear market (coming down): Hope ("just another zig-zag") → Worry → Fear ("what have I done") → Disgust → Disdain
Peak fear at the bottom. Peak greed at the top. Every time.
Corrections Between Phases (Craig's Key Rule)
- After accumulation ends → expect a 1/3 to 2/3 pullback of the accumulation gains
- After public participation ends → expect a 1/3 to 2/3 pullback of the public participation gains
- After excess ends → you don't just correct the excess. You correct the ENTIRE move from the start of accumulation to the top of excess. These are the major resets (GFC wiped 57% off S&P, crypto cycles pull back 80%)
This is why getting caught buying in the excess phase is so dangerous — you're not just giving back the excess gains, you're giving back everything. It can take 6-13 years to recover.
Phases Within Phases (Fractal Nature)
Each major phase contains its own sub-phases of accumulation, public participation, and excess. The more you zoom in, the more sub-phases you see. This concept is the foundation of Elliott Wave Theory (Term 3).
Example: The S&P 500 since 2009 has a big accumulation, big public participation, and big excess phase. But within the big public participation, there were smaller accumulation, public, and excess sub-phases.
Commodity vs Equity Phase Differences
- Equities/Indices: Public participation is the dominant, longest phase. Accumulation and excess are often similar sizes
- Commodities (and commodity stocks like lithium, gold, uranium miners): The excess phase can be disproportionately massive — huge blow-off tops. Public participation can be relatively smaller
Examples
- Bitcoin 2018–2021: Sideways accumulation 2018-2020, public participation started when 20K broke (savvy ones got in at 12K), excess phase when everyone was talking about "who's buying next after Tesla" — they distributed into the good news
- Microsoft: Parabolic into 2000 tech bubble, crashed, went sideways for 14 years (accumulation), broke out ~$37 resistance, then public participation trending up
- FMG: Massive spike pre-GFC, crashed to $1, accumulated for 10 years at $1-7, broke out and ran to $23+
- Core Lithium: Went up 9,700% — but most holders didn't get out and gave it all back (lost 96% from top). Perfect example of why understanding excess phase matters
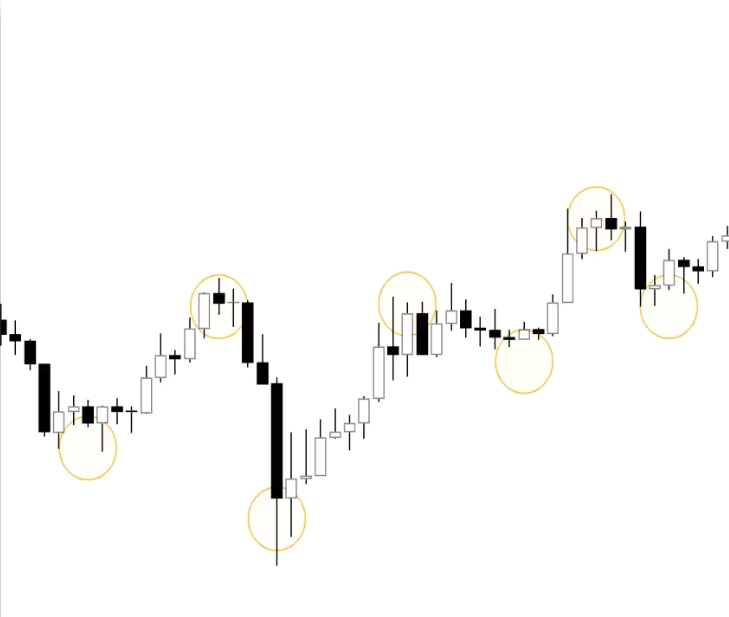
Pivot Points
If you cannot identify pivot points, you cannot identify market structure. If you cannot identify market structure, you cannot identify a trend. This is the literal backbone of technical analysis.
How to Identify Pivot pointsPoints
IdentifiedLookbyfor- 3 candles
goingmoving in the opposite direction
- 3 candles
"V"They don't have to be 3 red or"U"3shapedgreen candles — they can be a mix of colours. You're looking for the overall direction changing (3 candles moving the opposite way to the primary move)- Exceptions: During elevated market volatility, 1-2 very large candles can count as a pivot (e.g. a big bullish engulfing candle on its own)
- Craig's clarification: The 3-candle rule is a guide to prevent you marking 100 tiny pivots that add no value. What you're really looking for is significant peaks and significant troughs. If it's just undulating noise, you probably don't need a pivot there
- V-shaped: Rapid, sharp reversal — price quickly changes direction. Most common
- U-shaped: Gradual shift — price hangs around the bottom/top sideways for a bit before reversing
- Swing High (H): Pivot at the top where sellers step in — identifies resistance levels
- Swing Low (L): Pivot at the bottom where buyers step in — identifies support levels
- Use the highlighter tool in TradingView (small dots) to mark pivots
- Colour code: green dots for lows/buyers, red dots for highs/sellers — green=go, red=stop
- Line chart trick: Switch from candles to line chart to more easily see pivots when the wicks and candles are clouding your judgment. It strips away the noise and shows the pivots clearly
- Hold Ctrl + click on a dot to drag-copy it (saves time vs recreating each one)
- Start on the weekly timeframe — Dow himself never traded below the daily because it was all manipulated noise. The lower you go, the harder it gets. Weekly for the first 6 weeks minimum
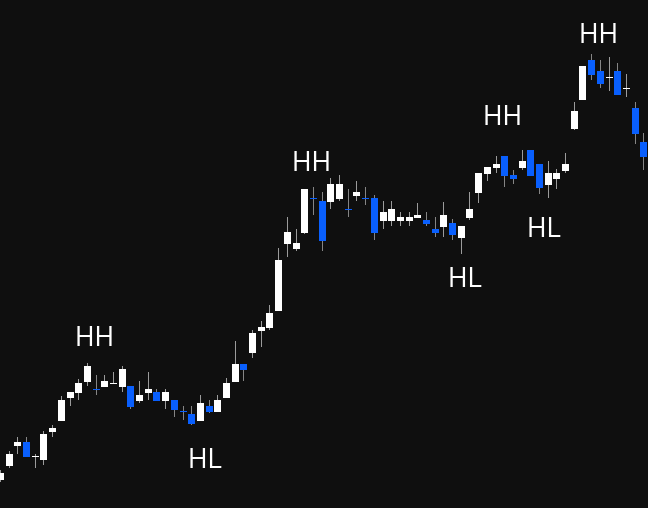
- The market is going up
- Marked by consistent higher highs and higher lows
- Pivot peaks are higher
thenthan the previous highs- —
Signalssignals increased demand and optimism
- Pivot lows are higher
thenthan previous low- —
Signalssignalsresilianceresilience,asbuyerstraderssteppingpreventin higher each time (buyers believe it won't go back to thepriceoldfrom dropping significantlyprice)
- Think: "Why are they buying at $18K when last time they didn't buy until $16K? Why are they selling at $20K when last time they sold at $18K?" — that's a strong uptrend
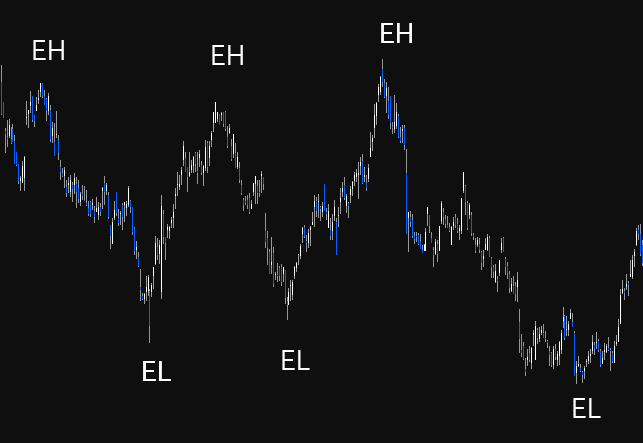
- Market moving sideways
- No clear trend — equal highs (selling at roughly the same level) and equal lows (buying at roughly the same level)
- Traders look for breakouts (above EH = potential uptrend) or breakdowns (below EL = potential downtrend)
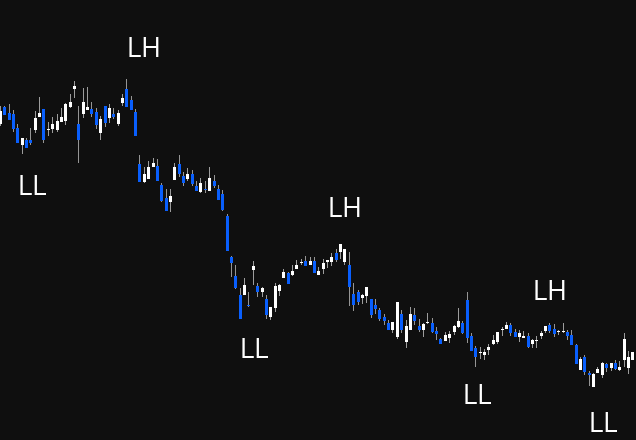
MarketThe market isdowngoing down- Lower Lows: each trough is lower than the previous — buyers waiting for lower prices each time
- Lower Highs: each peak is lower than the previous — sellers stepping in earlier each time, don't believe it will reach the previous high
- Think: "Why are they selling at $22K when last time they were selling at $23K? Why are they buying at $19K when last time they bought at $21K?"
- Can be good for shorting
- Bullish change: need a higher high AND a higher low. Getting just a higher high with a lower low is NOT a change — buyers are still coming in lower (still bearish)
- Bearish change: need a lower low AND a lower high. Getting just a lower low without a lower high is NOT confirmed
Pivot Point Shapes
Swing Highs and Swing Lows
Pivot points are also called swing points:
Practical Tips for Marking Pivots
The 3 Types Ofof Market structure
Structure
There are only 3 things a market can do: go up, go down, or go sideways. The first thing you should do when pulling up any chart is identify pivot points, then identify market structure.
"Market structure is king" — when you go against market structure, that's when you lose.
Bullish (HH / HL)
ConsolodationConsolidation (EH / EL)
Bearish (HHLL / HL)
LH)
Market Structure Change Confirmation
You need BOTH to confirm a change:
Connecting Pivots
Draw a line connecting your pivot points to visually see the trend direction. This makes it obvious when you transition from uptrend → sideways → downtrend.
Transition Through Phases Using Market Structure
Markets transition: Uptrend (HH/HL) → Sideways (EH/EL) → Downtrend (LL/LH) and vice versa. The phases map directly: Accumulation = sideways (EH/EL), Public Participation = uptrend (HH/HL), Excess = potentially still making highs but with warning signs, Distribution = begins transition to LL/LH.