
Reversal patterns, trend lines & channels
TheReversal patterns, trend islines your& friend
channels
- Theory Tenet 4: The Trend Is Your Friend
A trend will persist until its reversal is
indicatedindicated. UnderstandingLiketheNewton'strendfirsthelpslawtraders—avoidanunnecessaryobjectspeculationinandmotionalignstaystheirintradesmotionwithunlesstheacteddominantupon by an external force. A marketdirectionAtrend stays in motion until external factors cause ashift,shiftsuch as(fundamental news, economic data, or exhaustion inbuyingbuying/selling pressure).Why Trend Recognition Matters
- Prevents emotional trading — instead of guessing tops and bottoms, follow the existing trend
- Improves risk management — place stop losses under pivot lows, falling with market structure
- Maximises profit potential — trading in the direction of the trend increases probability of success
- Stay with the trend until price action (and later, volume) confirms a change
The Three Reversal Patterns
There are ONLY three ways a trend can reverse. Every reversal pattern you'll ever see fits under one of these three. That "cheat sheet with 50 different reversal patterns"? They're all just versions of these three.
1. Double Top / Double Bottom
The most common reversal pattern. Often called the "M pattern" (tops) or "W pattern" (bottoms). You can make money literally just trading these — they're textbook and easy to identify.
Double Top formation:
- Price reaches a peak (point 1), retraces to a low (point 2)
- Rallies back up but fails to exceed the previous high — selling
pressureequal (point 3). First warning sign: "Why are they selling at the same price? Every previous time they sold higher" - Declines and breaks below the support at point 2 (the "neckline"). First sell signal: sellers won. Buyers who stepped in at point 2 are no longer there
- Often retests the neckline as resistance (support/resistance flip) — because anyone who bought the dips now wants out if it gets back to their buy price
- Confirmation: when price breaks point 6 (below the retest low) = lower low, lower high, lower low = change of market structure
The psychology:
- Point 1 & 3: "I should have sold at $11. If it ever gets back there, I'll sell next time." The market gives second and third chances — it's uncanny how often this happens
- Point 2 vs 4: "They were willing to buy at $7.80 last time (point 2). Now they're not buying there. Where did those buyers disappear to?"
- The neckline break is pivotal: sellers at the same spot + buyers NOT at the same spot = bears won
Measured target: Distance from the double top to the neckline, projected downward from the neckline breakout point. That's your approximate target for the move.
Negation: If price gets back above the neckline, the double top is over — no longer expecting lower moves.
Double Bottom is the exact opposite. W-shaped. When you get big double bottoms over a large timeframe, they're textbook accumulation zones. Examples: FMG post-GFC ($1 double bottom), Apple ($13 double bottom), Cardano ($0.02 double bottom), Ethereum 2018-2020 double bottom.
For confirmation purposes, treat a double bottom exactly like a failure swing — the high between the two lows is the neckline, and confirmation is when you close above it.
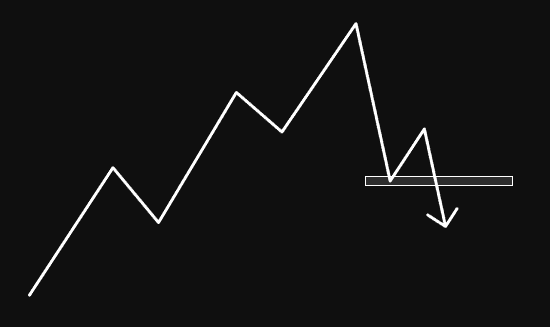
2. Non-Failure Swing (STRONGEST Reversal)
The
threemost powerful reversalpatternsbecauseonly proceedingbreaking top:Failureprior pivots but also getting a confirmed lower low, lower high, lower low (change of market structure).Non-failure swing
- HH,
top/bottomHL,
DoubleHL uptrend
—Non-Failurepatternswingnormally - Price makes a new high (point 5) — still going higher, all good
- Then drops below the previous higher low (point 4) — penetrates prior pivot. First warning sign
- This is where "buy the dip" gets dangerous — people keep buying the dip because it worked every other time. But when you can read market structure, you realise this is NOT the time to buy the dip. This is when big money distributes INTO the dip
- Rally back up but now forming a lower high (point 7) — second warning sign. "Why are they selling at $59K when every other time they sold at $64K, $61K?"
- Breaks below the prior low — confirmation. "This should be an absolute bargain. Why aren't they buying again?"

- Sell signal 1: When it breaks below the prior pivot (the first lower low)
- Sell signal 2 (stronger): When you get lower low + lower high + lower low = confirmed change of market structure
Why it's the strongest: Unlike the failure swing, a non-failure swing breaks through prior pivots AND gives you the full LL/LH/LL confirmation. The psychology flip is complete — people who were "buying the dip" every time are now watching it power straight through their buy levels.
Example: Bitcoin at $64K top and $30K bottom were both non-failure swings.
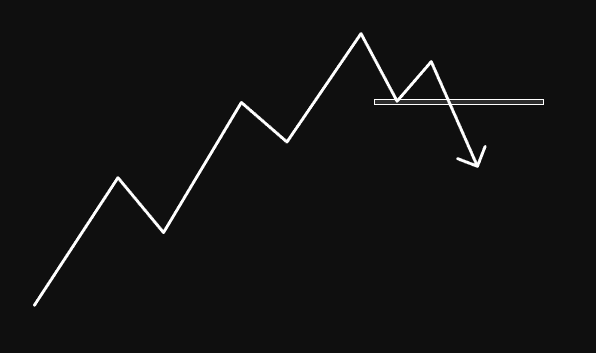
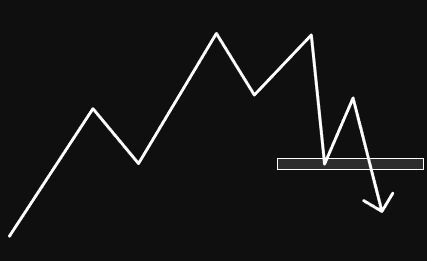
3. Failure
swingsSwingare(LEAST Reliable)How to identify (in a downtrend): The first sign is it fails to make a new low. Instead of continuing lower, it puts in a higher low. Then takes out the previous high.
How to identify (in an uptrend): The first sign is it fails to make a new high. Price makes a lower high, then breaks below the previous low.
Why it's called "failure" swing: Because the dominant trend failed to continue — it failed to make a new low (in a downtrend) or new high (in an uptrend).
Why it's the least
reliablereliable:asItit maycan just be an ABC correction (3 steps forward, 2 steps back). The market might bottom shortly after the failure swing exit and then continue the original trend. More depth on this comes with Fibonacci and zig-zag zones later in the course.A head & shoulders pattern is just a version of a failure swing. Shoulder, head, other shoulder — it's the same structure.
Craig's Key Confirmation Rules (Apply to ALL Three)
The critical thing that's the same across all three reversal patterns:
- Regardless of whether the higher high or higher low comes first, you must close above the previous high (in a downtrend reversal) to get confirmation
SellUsesignalcandle BODY closes, not wicks. Draw the confirmation line on the candle body. You need a candle close above that level, not just a wick- Match your timeframe: Weekly close for swing trades (most reliable, sets you up for months). Daily close for shorter trades (changes structure every few weeks). Hourly for intraday (lasts only hours)
- Weekly confirms are much more reliable than daily. A weekly change of market structure holds for a long period. Daily can flip back and forth quickly
- Once market structure has changed, you DON'T need to wait for reversal confirmation again on pullbacks. After confirmation (bearish → bullish), pullbacks in a bullish structure are buying opportunities. You only need the full reversal confirmation once — when the trend actually changes direction
The Non-Failure vs Failure Naming (Craig's Simple Explanation)
In a downtrend:
- Failure swing: The first sign is
breakit failed to make a new low. Then it takes out the high → confirmation - Non-failure swing: It did NOT fail to make a new low first. Instead, the first sign is it took out the previous high. Then it makes a higher low. Then confirms by taking out the next high → confirmation
In both cases, the final confirmation step is the same: close above the previous high.
Trend Lines
Trend lines use the same concepts as horizontal support/resistance (above = resistance, below = support) but at an angle.
How to Draw a Bullish Trend Line
- Find the lowest point of the
HLprice - Find the next 1-2 higher lows and connect a line across those points
- Draw the trend line below the price (
box)it acts as support — the floor) - Can
a
mix
- of candle bodies or wicks — context is key
FailsTwo points tobreakdraw, three points to confirm. The third touch validates theprevioustrendThe first sell signal isFind thebreakhighest point of theprevious HLpriceSecondFindsellthesignalnextis1-2 lower highs and connect abreaklineofacrossthethoseLL (box)pointsDouble top confirmation is when price breaks the LL
peak,makingHow to Draw a
LLBearish Trend Line
More conclusive sell signal at the pentitration of the lower supportConfirmatioin of the reversal happens when the price breaks below the LL (box)
acts as resistance — the ceiling)A breach of the prior support signals a potential change ofDraw the trend&linerepresentsaboveathetechnicalpricesell(itsignal- Try to encompass as many touches as possible — the more data confirming the line, the stronger it is
Trendto interpretation depending on how you draw them). You can draw two completely different trend linescanonhelptheidentifysame chart and both could be "right."Don't get caught up on exactly how the trend line is drawn. They're a signal, not gospel. What you're looking for is when
athe trend may be about to change. The confirmation is always the change of market structure (HH/HL or LL/LH), not the trend line break itself.Trend line breakout + retest as support = same concept as horizontal S/R flips. Very common for broken trend lines to get retested.
Advanced Trend Lines
Acceleration & Deceleration (Angular Momentum):
- Upside acceleration = bullish, but if rate of ascent is excessive, it may not be self-sustaining (blow-off top / buying climax that collapses)
TrendUpsidelinesdecelerationshould=bebearishdrawn(candletorangesconnectgettingassmallermanyandpointssmalleras—possiblebuying momentum fading)- Downside acceleration = bearish, but may end in a selling climax
- Downside deceleration = bullish
Measured Target for Trend Line Breakouts: Take the maximum distance price has moved away from the trend line, and project that same distance from the breakout point. That's your minimum price target.
Hot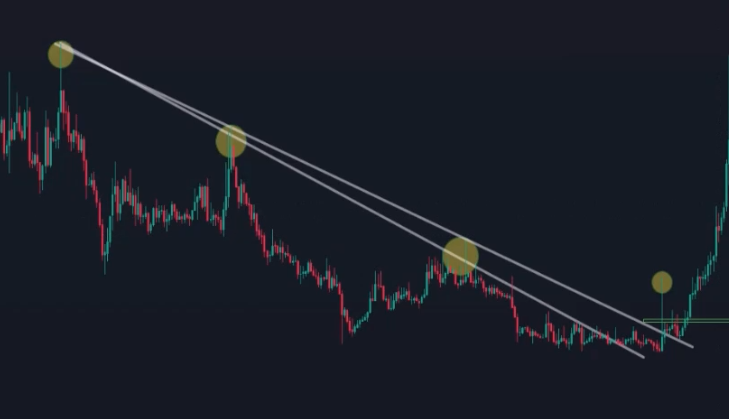
tip:
The easier it is and the more people that can spot the trend, the closer you are to it ending. When every man and his dog can see it, it probably won't hold.
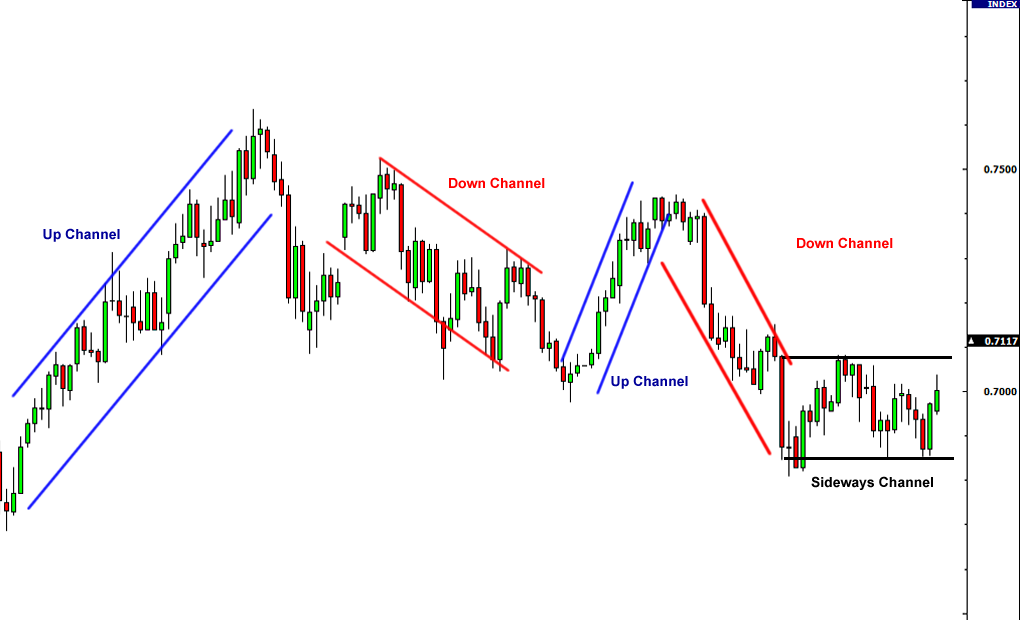
Channels
A channel is a
continuationsetpatternofwhereparallel trend lines (like train tracks) defined by the highs and lows of pricemovesaction.betweenThey present great trading opportunities and help with risk management.Three Types
- Ascending (bullish): Parallel upward lines — HH/HL. Buy at support (bottom line), sell at resistance (top line)
- Descending (bearish): Parallel downward lines — LL/LH. Short at resistance (top line), cover at support (bottom line)
- Sideways (neutral): Horizontal parallel
trendlineslines Channels—canEH/EL.beBuyupward,atsidewayssupport,orselldownat resistance until breakout
How to Draw Channels
- In TradingView: left toolbar → Trend line → arrow → Parallel Channel
- Find the lowest point (for ascending) or highest point (for descending)
- Draw along the support touches, then drag up/down to encompass resistance touches
- Try to get as many touches on both lines as possible
The Midline
Channel Validity
- Valid as long as price touches support at least twice and resistance at least three times (or vice versa)
- Breakout below support in an ascending channel signals potential reversal
- Breakout vs fake-out: If it breaks out and comes straight back in, it's probably a liquidity grab. If it breaks out and continues, it's a genuine breakout
Channel Exhaustion
If price fails to reach the upper line of an ascending channel, that's an early warning of trend exhaustion. The breach of the lower support line becomes more likely after a failure to reach the top.
S&P 500 100-Year Channel Example
Drawing a channel from the top of the Great Depression through the tech bubble on a 3-monthly chart shows that historically, when the S&P hits the upper channel resistance, it corrects back to at least the midline (dotted line). If things get really bad and oversold, it can come all the way back to the bottom channel line. This gives context for when things are at resistance, around the mean, or extremely undervalued.
Dow
TrendKey linesPrinciples
Dow theoryTheory states that the only valid trend linelines isare horizontal as— because angled trend lines are subjective
- (open

