
Volume analysis, Wyckoff techniques & On-balance Volume
Dow Theory Tenet 6: Volume
Must Confirm the Trend
DowVolume theoryis statesjust -the total number of shares/coins that changed hands in a period. Nothing more. It has nothing to do with price directly — it's simply how many units were traded. Think of volume must confirmas the pricefuel for the market — running on low fuel, it won't go far. Full tank, it'll keep going.
The theory states that ifIf volume is increasing along with the price trend, it suggests
thesmarttrendmoney isvalid,buyingifinto the trend. Smart money owns billions and generates the majority of volume. If volume doesn't confirm themovemove,itit'smaylikelysuggestdumb money (untrained retail traders) moving themoveprice.isThe
aFourfakeoutPrice-Volume If there is high volume at support and resistance levels, it means the level will be quite strong
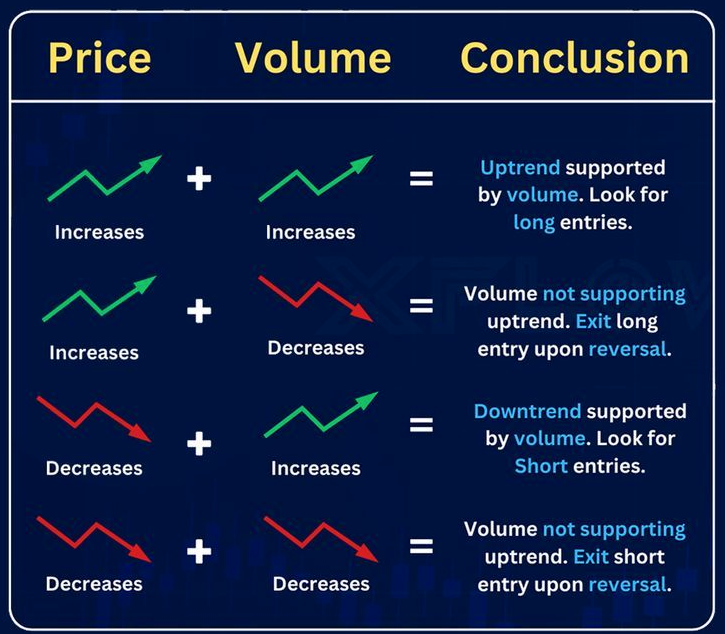
| Price | Volume | Signal | Meaning |
|---|
Rising
|
Rising
|
Bullish |
Uptrend supported byvolume. Stayin longs |
| Rising ↑ | Falling ↓ | Bearish — look to exit | Uptrend NOT supported by volume. Look to exit on further signs of reversal |
| Falling ↓ | Rising ↑ | Bearish — good for shorts | Downtrend supported by volume. Exit longs or look for shorts |
| Falling ↓ | Falling ↓ | Bullish — likely a pullback | Downtrend NOT supported. Probably just a correction/zag, not a new trend |
The biggest misconception: People think rising volume = good, falling volume = bad. Wrong. Rising volume just means the current trend is supported. If the trend is DOWN and volume is rising, that's confirming the downtrend — lots of people are still selling.
Key connection to Dow Theory: The secondary action (1/3-2/3 retracement) should happen on decreasing volume because it's a corrective move, not a new trend. Volume should support the primary trend, not the secondary correction.
OBVVolume at Breakouts: Fake Out vs Breakout
Just like all indicators, price is primary, OBV is secondary (price action is king)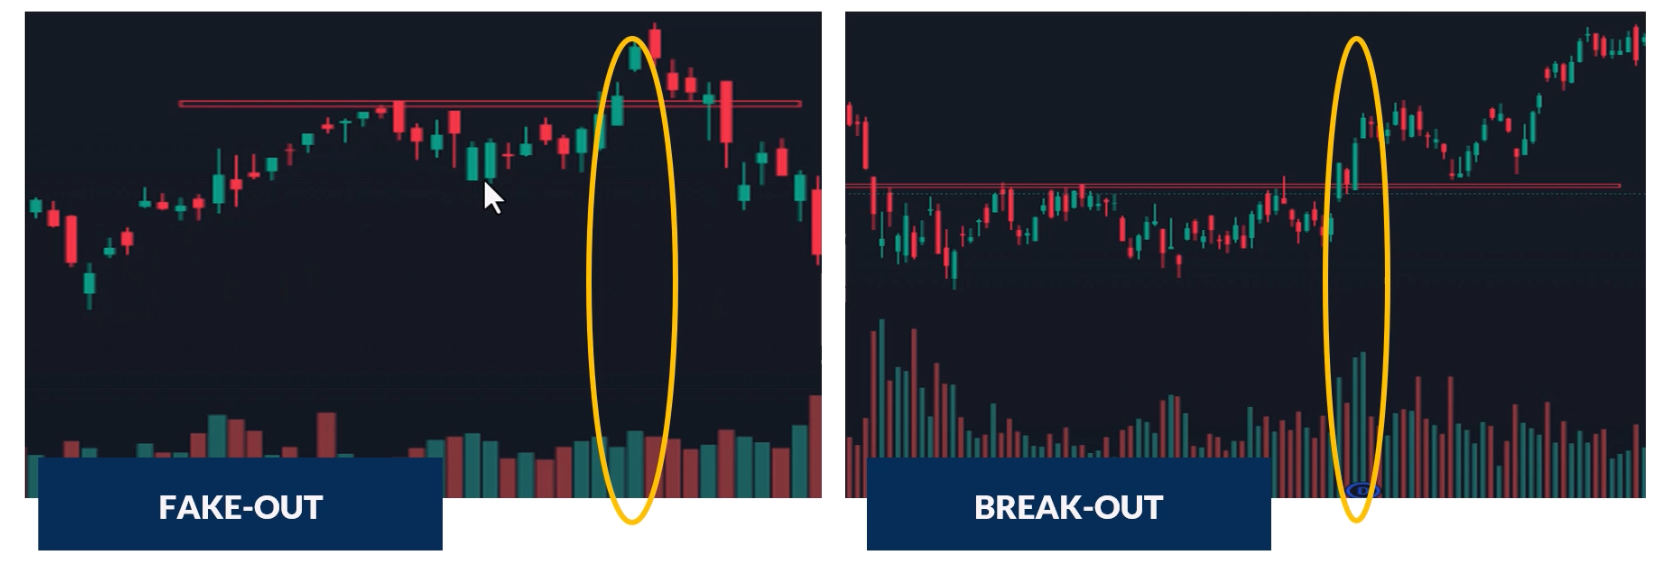
OnHigh volume on breakout = genuine breakout. Volume confirms the move. Smart money is behind it- Low or declining volume on breakout = likely fake out. Lack of interest, higher probability of false breakout
- Now whenever you see a change of market structure or break of S/R, check volume to confirm it's probably real
Volume at Support & Resistance
When there's high trading activity at support/resistance levels, those levels are more reliable — lots of investors treating them as buy/sell points means they'll likely continue to do so. High volume at support = probably going to hold. High volume at resistance = probably going to reject.
High Volume Spikes
High volume spikes tend to happen at extreme tops and extreme bottoms — that's where the most buyers and sellers are active:
- At bottoms: Capitulation — hesitant investors finally give up and massively sell. Volume spike marks the exhaustion of selling
- At tops: Exhaustion moves — climactic buying followed by sharp reversals
Wyckoff's Third Law: Effort vs Result
Richard Wyckoff (1873-1934), one of the TA Titans, developed a key principle about the relationship between volume (effort) and price movement (result).
Price-Volume Convergence (Effort = Result)
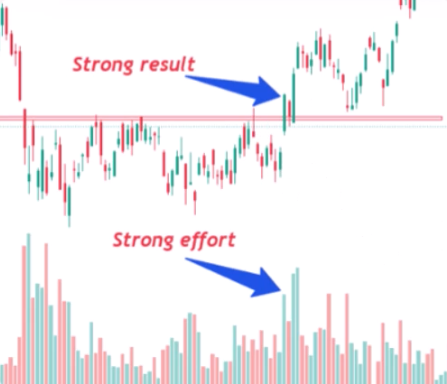
When both price and volume move in the same direction, market participants are in agreement. Large body candles + large volume = convergence. The current trend is likely to continue.
Gym analogy: If you go to the gym every day for 3 months (big effort), you should see your body change (big result). That's convergence — effort matches result.
Price-Volume Divergence (Effort ≠ Result)
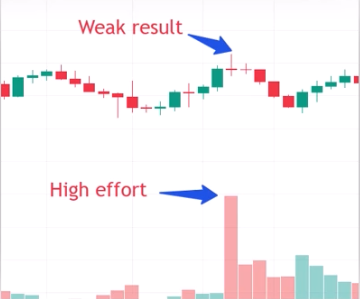
Small candle body + high volume = potential shift in market sentiment. The market required a lot of effort but barely moved — something is wrong. High volume doji candles are classic divergence signals and often precede reversals.
Gym analogy: If you go to the gym every day for 3 months (big effort) and look in the mirror and nothing's changed (no result) — something's up.
On-Balance Volume (OBV)
Created by Joseph Granville in 1963. His theory: changes in volume precede price movements. OBV is a leading indicatorindicator and— it changes direction before price, it can help traders predict where price actiondoes.
How to interepretAdd OBV in TradingView
Indicators → search "OBV" → On Balance Volume → add. The blue line appears below the OBVchart. Double-click anywhere blank on the chart to hide/show it quickly.
IfOBV WorksOBV is
rising,aitcumulativemeansrunningthetotal of volume — adding volume on updaysdays, subtractingisonbiggerdownthendays:the- OBV line rising = volume on
downgreendays.candles is higher than volume on red candles = buying pressure = bullish IfOBV line falling = volume on red candles is higher than volume on green candles = selling pressure = bearish- OBV line sideways = equal volume on up and down days = on par
The King & Queen Rule (CRITICAL)
"Price action is king. OBV is
falling,the queen. Listen to the king first, then see if the queen supports what the king is saying. Do NOT listen to the queen first."Follow your price action first — market structure, reversal patterns, everything you've learned. Once you identify a setup, THEN check if OBV supports it. Do NOT look at OBV first and try to make the price action fit. You will get wrecked doing it
meansbackwards.theDetox
volumeyouroncharts:theRemovedownalldaysindicators. Analyse price action clean. Only then add OBV to confirm. The price action ishigherprimarythen up days.- OBV line rising = volume on
OBV is a great indicator for assessing the liklihood of successful breakouts or breakdowns by detecting convergence or divergenceYou can also do TA on the OBV and use it as a sell indicator
How
In short: the idea behinddata, OBV is thatsecondary.
The Five OBV Scenarios
1. Bullish Divergence Breakout: OBV reaches a new high while price shouldapproaches followresistance volume.→ predicts price will break through resistance and head higher. OBV is leading — it's already broken out before price has.
If2. Bearish Divergence Breakout: OBV hits a new low while price keepstests makingsupport higher→ highspredicts butprice will break support and head lower. OBV already broke support before price did.
3. Bearish Divergence Reversal: Price rises to a new high while OBV hovers at or below athe previous resistance level you→ havepredicts the rally will stall or reverse. Volume is NOT confirming the new highs. If price keeps making new highs but OBV keeps hitting a wall — that's bearish divergence!divergence.
4. Bullish Divergence Reversal: Price hits a new low while OBV stalls at or above the last support level → predicts the sell-off will stall or reverse. Price made a new low but volume didn't — something different, bullish divergence.
5. Convergence (Bullish or Bearish): OBV matches price action — when price goes up, OBV goes up; when price goes down, OBV goes down. This confirms the current trend is valid.
The Simple 95% Use Case
Most people (and this is perfectly valid) use OBV for one thing: does the OBV line do the same thing as price? When price makes HH/HL, does OBV also make HH/HL? If yes, volume confirms the move. If not, something's different. That alone is quite powerful as a confirmation tool.
Advanced OBV Strategies
Drawing TA on OBV
Everything you've learned from price action — support, resistance, trend lines, market structure — can be applied directly to the OBV line:
- Trend lines on OBV: Draw bullish/bearish trend lines on OBV just like on price. When OBV breaks its downtrend line, it can signal a reversal before price breaks its own trend line
- Support/resistance on OBV: Horizontal S/R zones work on OBV. When OBV breaks support that becomes resistance (same flip concept), it confirms the move
- Market structure on OBV: Look for HH/HL or LL/LH on the OBV line — it often changes structure before price does
OBV as Leading Indicator (Key Examples)
ASX Trader's Bitcoin call at $65K top: OBV broke its uptrend line while price was still making new highs. OBV had bearish divergence + trend break = exit signal. Price didn't actually break its trend until much lower (~$51K). OBV led the way.
Getting back in at the bottom: OBV broke its downtrend line and showed bullish divergence before price broke out. Combine downtrend break on OBV + bullish divergence = entry signal.
Avoiding Fake Rallies with OBV
When you see a rally and think it's a breakout — check if OBV has also broken its downtrend line. If OBV hasn't broken its decline, the rally is likely a fake. This stops you entering fake rallies. Match the actual breakout point on OBV (using a vertical line) with where price breaks out — they should align at the genuine breakout, not the fake ones.
Note: Fibonacci Clusters
The Fibonacci clusters lesson was included in this week's content but relates more to the Fibonacci & Retracement Zones topic. Key concept: overlay Fibonacci retracements from multiple timeframes (e.g. daily retracement + monthly retracement) to find "cluster zones" where multiple Fib levels overlap — these are stronger support/resistance zones than a single Fib level alone. Example: Microsoft's 618 from the COVID bottom overlapping with the 382 from the entire move created a powerful cluster support zone.