1.3 - Reversal patterns, trend lines & channels
The trend is your friend
- A trend will persist until its reversal is indicated
- Understanding the trend helps traders avoid unnecessary speculation and align their trades with the dominant market direction
- A trend stays in motion until external factors cause a shift, such as news, economic data, or exhaustion in buying or selling pressure
The three reversal patterns
Failure swing |
Double top/bottom |
Non-Failure swing |
|
|
|
|

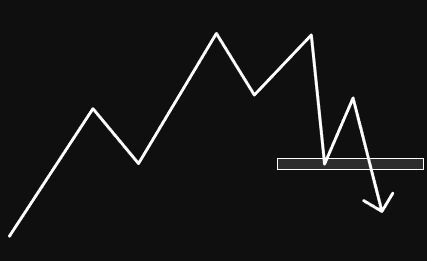

A breach of the prior support signals a potential change of the trend & represents a technical sell signal
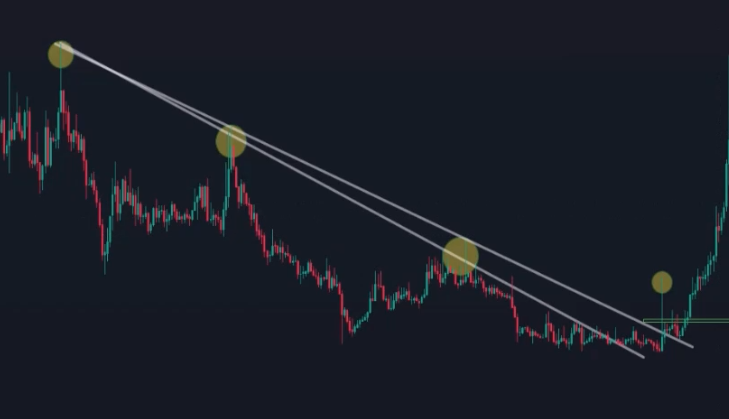
Trend lines
Dow theory states that the only valid trend line is horizontal as angled trend lines are subjective
- Trend lines can help identify when a trend may be about to change
- Trend lines should be drawn to connect as many points as possible
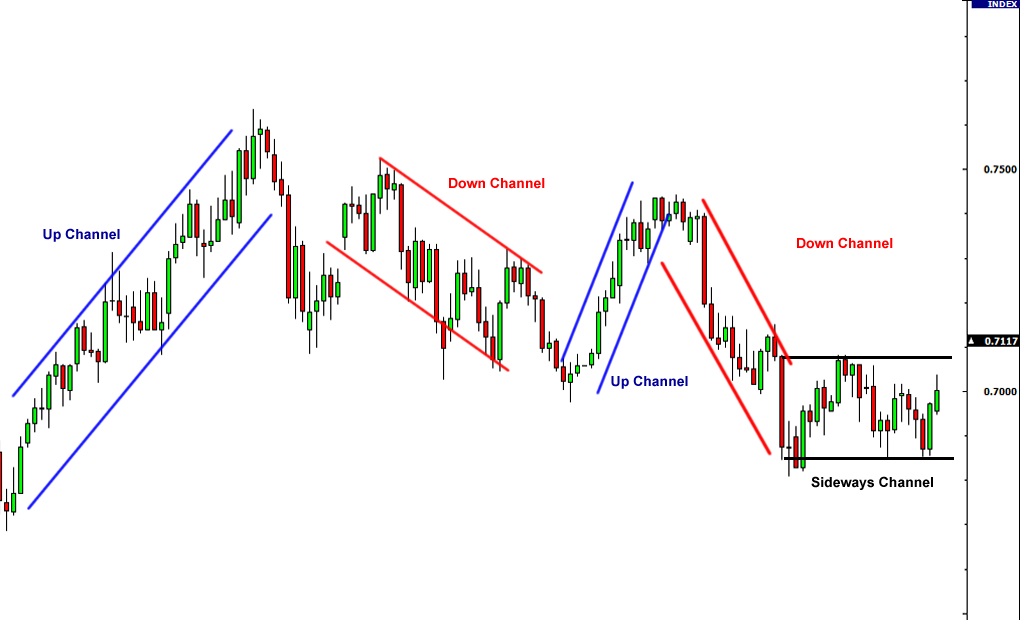
Channels
- A channel is a continuation pattern where price moves between parallel trendlines
- Channels can be upward, sideways or down