
2.1 - Complex (confusing) divergence
Complex divergence is when you get regular divergence turning into hidden divergence
RSI recap
- RSI is a momentum indicator
- Overbought > 70
- Oversold < 30
Regular divergence
- Only starts after indicator hits an extreme
- Warns the current trend is weakening (price makes HH but indicator makes HL)
- Multiple hits of the same divergence increases the probability of a bigger move
Multi-timeframe divergence
- If divergence is found on the 1D & 1HR, it suggests a stronger potential to reverse comapred to divergence on one timeframe
- EG: BTC in 2021, divergence on the weekly, daily, hourly
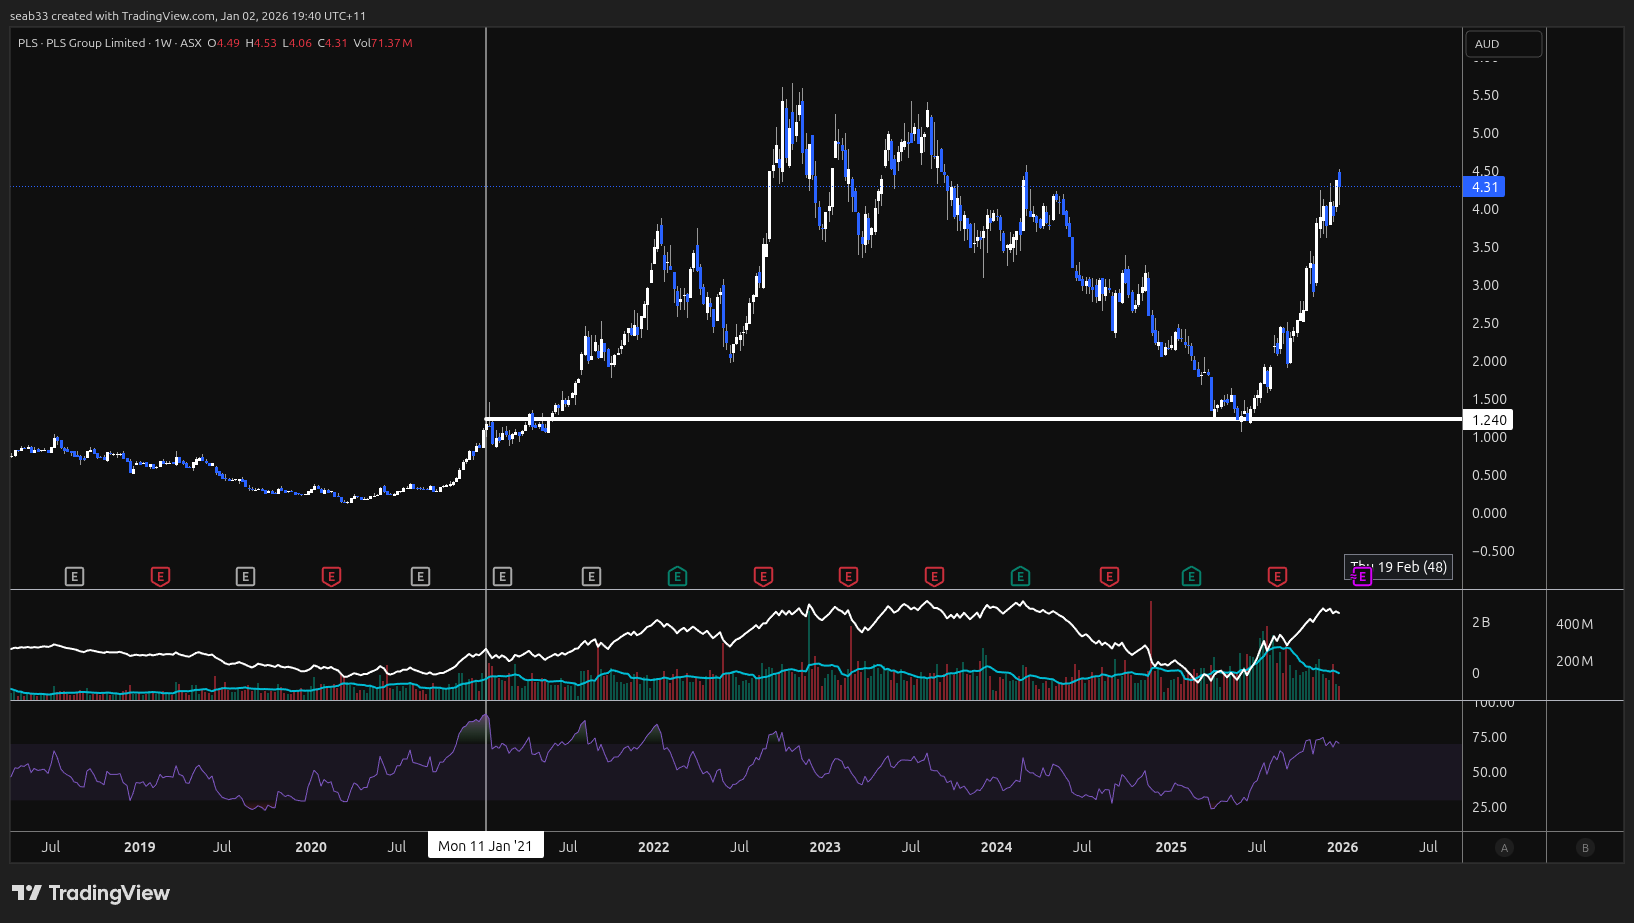
When divergence has "played out"
- When the RSI comes back into convergence - the market is in sync with the indicator
- The peak of the RSI is a good marker for where price can come back to (see PLS below)
RSI reset
- When rsi resets - it means the RSI has gone from one extreme to the other
- DON'T pay attentionto the RSI data to the left of the reset